
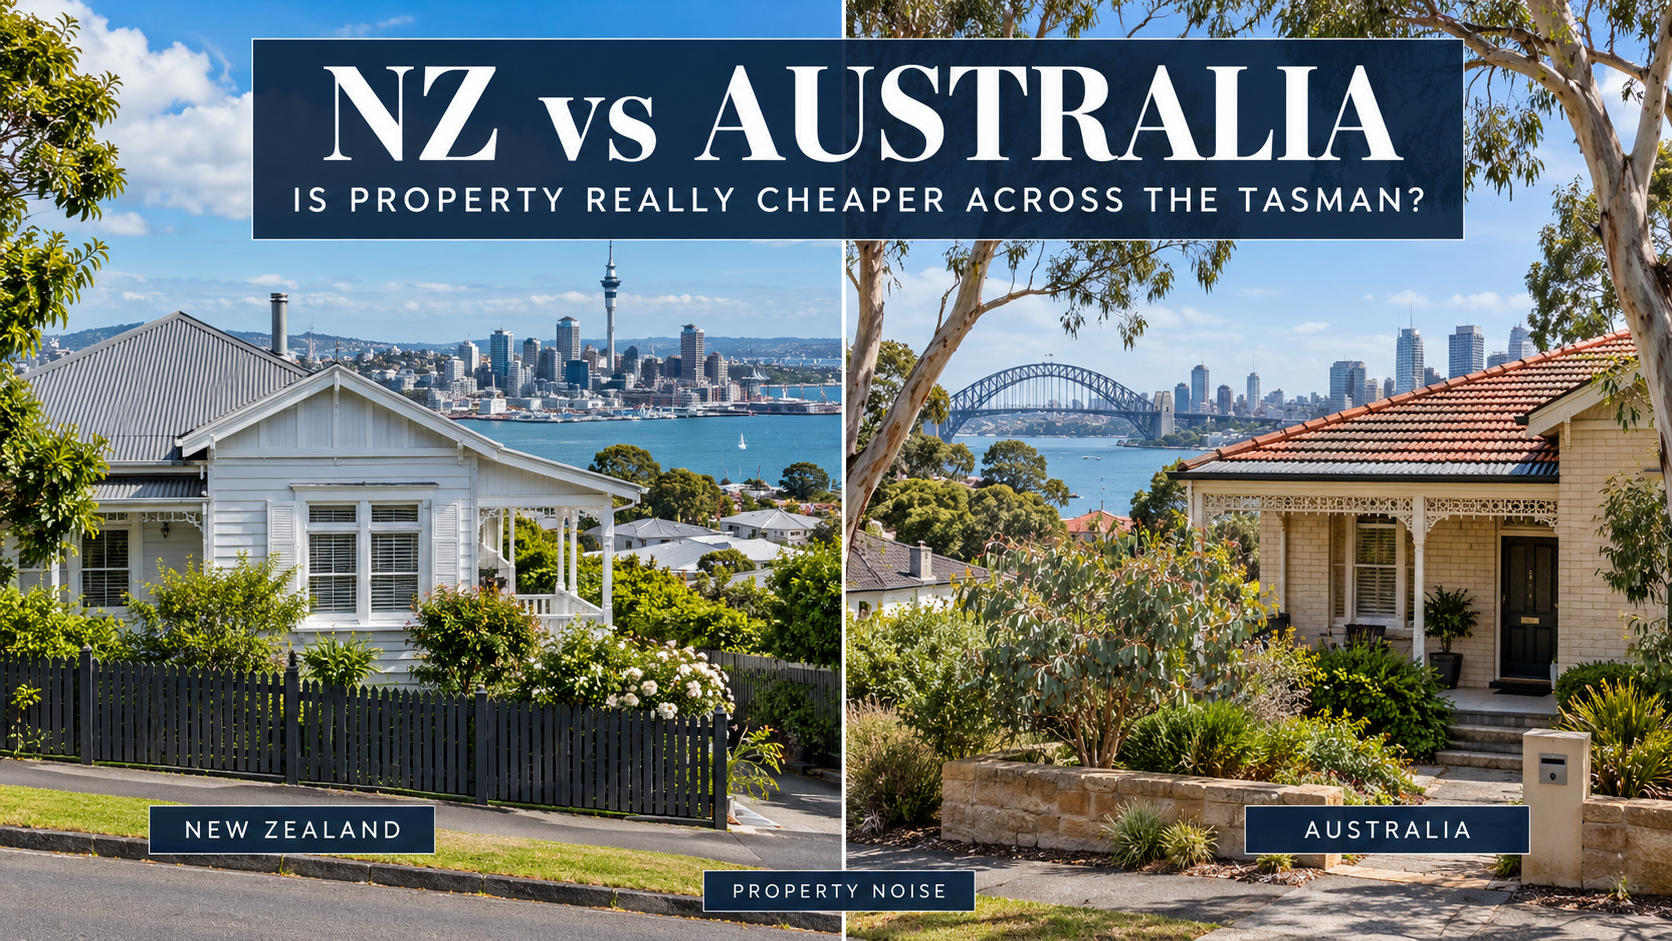
Moving to Australia is often presented as a shortcut to a better financial future. But when it comes to buying property, the answer depends heavily on where you leave—and where you land.
Sydney remains substantially more expensive than Auckland. Brisbane and Perth also carry significant price tags once Australian dollars are converted into New Zealand currency.
Melbourne, however, tells a different story.
Its median dwelling value now sits below Auckland’s after currency conversion, while Darwin offers a lower entry point than the other Australian capitals.
Across the Tasman, Christchurch, Hamilton and Dunedin remain materially cheaper than most Australian capital cities on the same broad measure.
For buyers weighing their options, the national averages are only the beginning.
How we compared New Zealand and Australian property
This comparison uses Cotality’s September 2026 median dwelling values, covering houses and units together.
These are estimated property values—not median sale prices, asking prices or detached-house-only figures.
Using the same provider and reporting month gives a more consistent comparison, although differences in housing stock, city boundaries and modelling remain.
For the currency comparison, Australian figures are converted at a rounded illustrative rate of A$1 = NZ$1.23. This is close to exchange-rate readings available when preparing this article, but it is not a bank transfer quote.
Converted values are rounded to the nearest NZ$1,000.
A median describes the middle of a market. It does not tell you what a particular home is worth or what your household can afford.
The national picture: Australia carries the higher price tag
| Country | Median dwelling value in local currency | Approximate value in NZ dollars |
|---|---|---|
| New Zealand | NZ$797,078 | NZ$797,000 |
| Australia | A$899,236 | NZ$1,106,000 |
On this currency-adjusted comparison, Australia’s national median dwelling value is approximately 39% higher than New Zealand’s.
That does not establish that Australians face a 39% greater affordability burden. An affordability assessment would also need local household incomes, borrowing costs, taxes and other expenses.
But it does challenge the assumption that buying in Australia automatically means buying a cheaper home.
Australia state by state: Every capital city compared
The table below covers all six states and both mainland territories through their capital-city markets.
These are capital-city figures, not whole-state medians.
| State or territory | Capital | Median dwelling value, A$ | Approximate NZ$ equivalent |
|---|---|---|---|
| New South Wales | Sydney | $1,198,596 | $1,474,000 |
| Victoria | Melbourne | $780,550 | $960,000 |
| Queensland | Brisbane | $1,048,880 | $1,290,000 |
| South Australia | Adelaide | $928,560 | $1,142,000 |
| Western Australia | Perth | $975,022 | $1,199,000 |
| Tasmania | Hobart | $741,496 | $912,000 |
| Northern Territory | Darwin | $633,431 | $779,000 |
| Australian Capital Territory | Canberra | $861,744 | $1,060,000 |
New South Wales: Sydney remains the expensive option
At approximately NZ$1.474 million, Sydney’s median dwelling value is about 44% above Auckland’s.
A move from Auckland to Sydney therefore does not produce a cheaper median property purchase on these figures.
Individual apartments and outer-suburban properties can tell a different story, but buyers need to compare the type of home and location they would realistically purchase.
Victoria: Melbourne changes the conversation
Melbourne’s median dwelling value converts to approximately NZ$960,000—around 6% below Auckland’s.
It is also below Brisbane, Perth and Adelaide in Australian-dollar terms.
That makes Melbourne an important exception to a simple “Australia costs more” conclusion.
However, the combined dwelling median includes apartments. Someone seeking a detached family home should compare house-only figures and suitable suburbs before drawing conclusions about their budget.
Queensland: Brisbane is no longer a budget assumption
Brisbane’s median dwelling value translates to approximately NZ$1.290 million, exceeding both Auckland and Tauranga.
For Kiwi buyers, the lesson is straightforward: Queensland lifestyle appeal should not be mistaken for a low property entry price.
A Brisbane purchase also needs to be distinguished from buying elsewhere in Queensland.
South Australia: Adelaide carries a substantial price tag
Adelaide’s converted median sits at approximately NZ$1.142 million, above Auckland’s.
Its position illustrates why older perceptions of Australian cities can become unreliable guides to current purchasing costs.
Western Australia: Perth requires a fresh budget
Perth’s median dwelling value converts to approximately NZ$1.199 million.
It remains cheaper than Sydney and Brisbane, but above Auckland on this measure.
For a Kiwi household, Perth’s financial appeal therefore needs to be assessed through the full combination of earnings, property choice and living costs.
Tasmania: Hobart sits below Auckland, above several NZ centres
Hobart’s approximate NZ$912,000 equivalent is below Auckland and slightly below Tauranga.
It remains above Wellington, Hamilton, Christchurch and Dunedin.
That puts Hobart in a different position depending on where a buyer is moving from.
Northern Territory: Darwin has the lowest capital-city median
Darwin is the least expensive Australian capital in this comparison at approximately NZ$779,000.
That places it below Auckland and Tauranga, but still above several of New Zealand’s main-centre medians.
A lower purchase price is only one consideration when comparing employment options, climate, insurance and the practicalities of living in a different market.
Australian Capital Territory: Canberra crosses NZ$1 million
Canberra’s median translates to approximately NZ$1.060 million, slightly above Auckland.
It is considerably above Wellington’s median dwelling value, demonstrating that the two national capitals occupy different price positions.
Regional Australia: There is more beyond the capitals
Cotality also publishes values for the markets outside each state capital.
These broad regional aggregates include very different towns and cities. They are not prices for one particular regional centre.
| Market outside the capital | Median dwelling value, A$ | Approximate NZ$ equivalent |
|---|---|---|
| Regional New South Wales | $824,912 | $1,015,000 |
| Regional Victoria | $634,360 | $780,000 |
| Regional Queensland | $834,425 | $1,026,000 |
| Regional South Australia | $564,017 | $694,000 |
| Regional Western Australia | $715,643 | $880,000 |
| Regional Tasmania | $622,460 | $766,000 |
A comparable combined-dwelling figure was not available for regional Northern Territory in the report’s table. The ACT is represented by Canberra.
For buyers considering Newcastle, Wollongong, Geelong, the Gold Coast, Sunshine Coast or other regional centres, the relevant local market needs its own comparison.
A regional Queensland average cannot be treated as a Gold Coast price, just as an Otago average cannot stand in for Queenstown.
New Zealand’s six main centres compared
| NZ main centre | Median dwelling value, NZ$ |
|---|---|
| Auckland | $1,021,936 |
| Tauranga | $932,469 |
| Wellington | $755,115 |
| Hamilton | $735,480 |
| Christchurch | $731,240 |
| Dunedin | $622,388 |
The differences within New Zealand are substantial.
Auckland remains the most expensive of these six centres, while Dunedin’s median is approximately NZ$400,000 lower.
Hamilton and Christchurch sit close together. Wellington is only modestly higher than those two cities, while Tauranga remains nearer Auckland’s price level.
Property Noise has previously explored Christchurch’s distinct position in Christchurch leaves Auckland in the dust as New Zealand’s fastest property market.
Where does the comparison favour Kiwi buyers?
The clearest price advantage for staying in New Zealand appears when comparing Christchurch, Hamilton or Dunedin with most Australian capitals.
A buyer leaving Christchurch for Brisbane, for example, is moving from a median dwelling value of approximately NZ$731,000 to a converted figure of approximately NZ$1.290 million.
That is a substantial increase in the purchase-price benchmark.
An Auckland buyer considering Melbourne faces a different equation: Melbourne’s converted median is lower.
Neither comparison guarantees the cost of an equivalent home. Dwelling mix, suburb, condition, land area and commuting requirements can change the result.
A falling market can still be an expensive market
Recent weakness does not automatically make a city cheap.
Australia’s national dwelling values fell 1.1% in September, while New Zealand’s declined 0.3%.
Both countries recorded a sixth consecutive monthly fall.
For buyers, the important distinction is between direction and level. A market can be falling while retaining a high entry price.
Property Noise previously examined Australia’s changing outlook in Australia’s property market is cracking: Big Four bank doubles housing fall forecast.
Asking prices are a separate measure
New Zealand readers may notice these figures differ from the latest Trade Me asking-price report.
That is expected.
Trade Me measures the price expectations associated with listings. Cotality’s figures estimate dwelling values across the market.
Different measures can move in different directions without either being wrong.
A rising asking-price average should therefore not be substituted directly into this comparison or treated as proof that completed sale prices have risen.
Property Noise conclusion: Choose the city before choosing the country
Australia is not automatically the cheaper place to buy a home. On the figures examined here, its national median dwelling value is materially higher after currency conversion.
Sydney is substantially above Auckland. Brisbane, Perth and Adelaide also exceed Auckland’s median.
Melbourne provides a meaningful exception, while Darwin offers Australia’s lowest capital-city entry point.
For buyers based in Christchurch, Hamilton or Dunedin, moving to most Australian capitals means stepping into a higher-priced market.
The financial case for moving can still be strong if household earnings and opportunities improve enough. But that case needs a household budget, rather than a comparison of unconverted dollar figures.
The strongest conclusion is that the city, suburb and type of home matter more than the flag. Australia can offer opportunity—but a cheaper property is not guaranteed.
Methodology and sources: Cotality’s October 2026 Australian Home Value Index, reporting values at 30 September; Cotality NZ’s September 2026 Home Value Index and accompanying main-centre table. Figures cover all dwellings rather than detached houses alone. Australian values are converted at an illustrative A$1 = NZ$1.23 and rounded to the nearest NZ$1,000. Capital-city boundaries, housing composition and modelling differ. This is a market-price comparison, not an income-adjusted affordability ranking.