
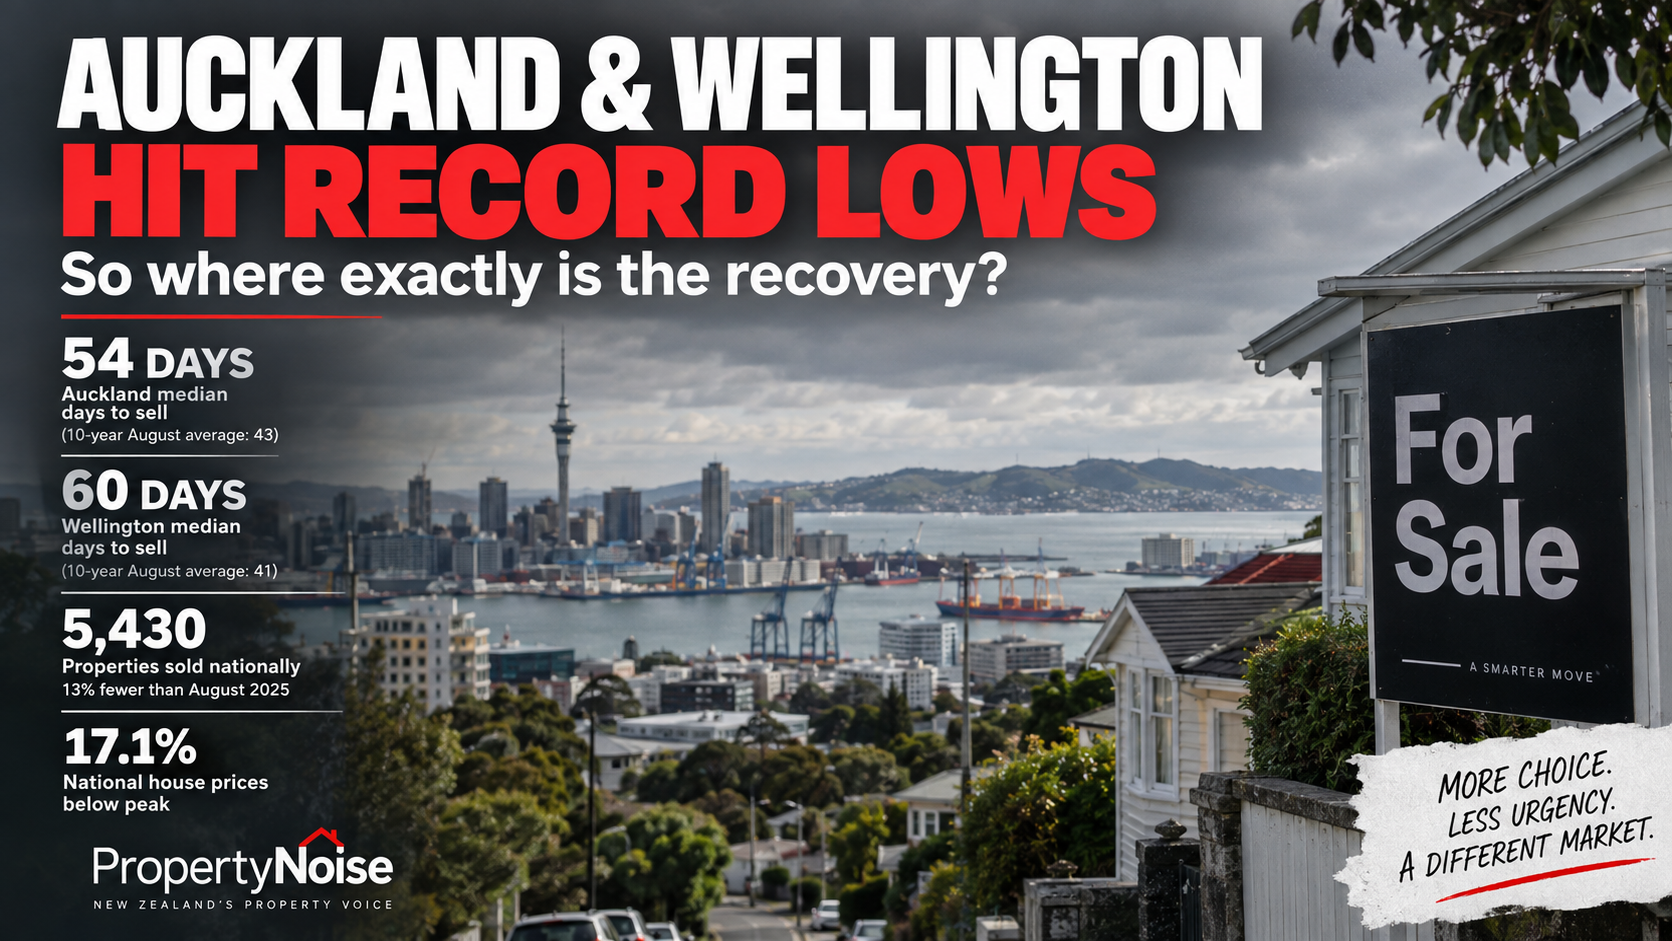
PHOTO: In the country’s two biggest metropolitan property markets, the bigger problem may no longer be affordability.
PROPERTY NOISE NZ | MARKET ANALYSIS
For much of the past two years, New Zealand’s housing market has been waiting for the recovery.
Interest rates fell. Affordability improved. First-home buyers returned. Predictions of a property-market rebound became almost routine.
Yet the latest August 2026 numbers have delivered an uncomfortable reality check.
Auckland and Wellington have just recorded their longest-ever August selling times. Wellington recorded its lowest number of August sales on record. National sales fell 13% from a year earlier. And New Zealand house prices remain 17.1% below their peak.
This isn’t the recovery many expected.
In the country’s two biggest metropolitan property markets, the bigger problem may no longer be affordability.
It’s urgency.
Buyers have plenty of properties to choose from — and increasingly little reason to rush.
54 days in Auckland. 60 days in Wellington.
The latest REINZ August data is particularly striking when you look at how long vendors are waiting to sell.
Auckland: 54 days
10-year August average: 43 days
That’s 11 days — or roughly 26% — longer than the decade average.
Then there’s Wellington.
Wellington: 60 days
10-year August average: 41 days
That’s a staggering 19 days longer, or approximately 46% above its 10-year August norm.
Both were the longest August selling periods REINZ has recorded for those markets.
For vendors accustomed to hearing that lower interest rates would bring buyers flooding back, those numbers tell a very different story.
Nationwide, the numbers aren’t much prettier
Just 5,430 residential properties changed hands across New Zealand in August.
That’s 13% fewer than August 2025.
More importantly, according to the supplied REINZ data, it was the sixth-lowest August sales total in 35 years.
Put another way, there have been only five Augusts in three-and-a-half decades when fewer houses changed hands.
And this follows an already soft July. REINZ reported 6,090 sales in July, down 10% year-on-year, with a national median price of $760,000.
So this isn’t simply one strange monthly result.
There is a broader lack of momentum.
Auckland is still almost 25% below its peak
Perhaps the most sobering numbers are what has happened to values since the boom.
According to the latest REINZ figures supplied to Property Noise:
New Zealand: -17.1% from peak
Auckland: just under -25%
Wellington: -30.3%
Canterbury: just -0.8%
Otago/Southland: -1.1%
Wellington’s fall is extraordinary.
A house valued at $1 million at the theoretical market peak would, applying a 30.3% decline mechanically, be equivalent to around $697,000 today.
For Auckland, a $1 million peak value subjected to a 25% decline would be around $750,000.
Of course, individual properties and suburbs vary enormously. But those percentages illustrate the scale of the correction.
And independent Cotality data isn’t signalling an imminent surge either.
Its August Home Value Index recorded another 0.4% monthly decline nationally — the fifth consecutive month values had fallen. Auckland dropped another 0.5% during August and Wellington another 0.6%.
Five consecutive months of falling values isn’t a property recovery.
At best, it’s a market still searching for its bottom.
The great Auckland property boom has met its opposite: choice
Here’s perhaps the most important number in the entire story:
32,908 homes were for sale nationally in August.
That’s according to realestate.co.nz.
And while that number itself is significant, the historical comparison is even more revealing.
There are now 45% more homes for sale than there were three years ago.
That’s around 10,000 additional properties competing for buyers.
Auckland’s available stock was up 11.5% year-on-year, while Wellington’s was up 12.9%.
Suddenly those record selling times make a lot more sense.
Buyers don’t need to panic.
They don’t necessarily need to make an offer tonight.
They don’t have to overlook the dated kitchen, questionable bathroom, awkward section or ambitious asking price because another house could be coming along tomorrow.
The buyer can simply move on.
And that fundamentally changes the psychology of a housing market.
FOMO has disappeared from Auckland
REINZ chief executive Lizzy Ryley’s description of Auckland is probably the most revealing assessment of the market right now.
She says there’s currently “no real fear of missing out”.
That’s enormously significant.
Because FOMO was one of the engines behind the extraordinary 2020-2021 property boom.
Buyers weren’t simply purchasing houses.
They were racing other buyers.
Auctions were packed.
Deadlines were brought forward.
Multiple offers were common.
And buyers worried that if they didn’t purchase today, the same property could cost another $50,000 or $100,000 several months later.
In 2026, that psychology has largely reversed.
Why hurry when prices aren’t running away from you?
Why make your best offer immediately when a property has already been sitting there for seven weeks?
Why compromise when there are dozens of alternatives?
FOMO has become WAIT-AND-SEE.
Look at what has happened to Auckland apartments
There’s another number that should concern Auckland property owners and investors.
Cotality reported that Auckland apartment values were down 7.8% over the year, compared with a 2.2% fall for standalone houses.
That’s a sizeable divergence.
It suggests the correction isn’t occurring uniformly.
Different property types, suburbs and regions are increasingly behaving like completely different markets.
And that leads to another remarkable feature of 2026.
Forget the “New Zealand property market” — there are two markets
The North and South Islands are telling dramatically different stories.
While Auckland and Wellington struggle, REINZ’s August figures show:
Southland: median $505,000 — +7.4% YoY
Tasman: +5.6%
Northland: +3.6%
West Coast: +2.5%
Canterbury: +1.5%
Compare that with Wellington sitting 30.3% below its market peak.
The phrase “New Zealand housing market” is becoming increasingly misleading.
There isn’t one market.
There are dozens.
And right now the South Island generally has something Auckland and Wellington don’t:
Scarcity.
Where stock is tighter, buyers have greater incentive to make decisions.
Where stock is abundant, they can wait.
First-home buyers may be the real winners
There’s another fascinating shift happening underneath these numbers.
Cotality reported that first-home buyers captured a record 29% share of purchases in its July data.
Nearly three out of every ten purchases.
That makes sense.
Prices have fallen dramatically from their peaks.
There is significantly more choice.
Competition is subdued.
And affordability has improved.
Cotality recently concluded that NZ housing affordability had returned broadly towards long-term norms.
This may therefore be a miserable market for somebody who bought at the peak and needs to sell.
But it could be one of the most buyer-friendly markets we’ve seen for years.
That’s why Ryley’s description of the current environment as an “amazing” time for first-home buyers deserves attention.
Buyers have something they barely possessed during the boom:
Negotiating power.
Vendors may still be living in 2021
And here lies one of the biggest problems facing real estate agents.
The market can change much faster than vendor expectations.
A homeowner remembers what their neighbour sold for.
They remember the 2021 valuation.
They remember the agent who appraised their property six months ago.
They’ve calculated what they need for their next purchase.
Unfortunately, none of those things determine what today’s buyer will pay.
The market does.
With 32,908 properties available nationally and buyers taking record amounts of time in Auckland and Wellington, overpriced properties are increasingly exposed.
They don’t create urgency.
They simply help correctly priced competing properties look better.
This could also become a real estate agent problem
There is another uncomfortable side to the slowdown.
Earlier this week, Property Noise examined reports of NZ real estate agents taking second jobs as transaction volumes remain subdued.
Now consider the August number:
5,430 sales.
New Zealand has roughly 12,850 licensed real estate salespeople.
That isn’t 5,430 sales per salesperson.
It’s 5,430 transactions across an entire country and an entire month being chased by a huge salesforce.
Obviously one month can’t simply be divided among agents — listings involve different agencies, some agents sell substantially more than others, and not every licensee is equally active.
But it illustrates just how ferocious the fight for listings and commissions has become.
The market isn’t only testing vendors.
It’s testing the real estate industry itself.
And the promised recovery?
This may be the question property commentators need to start asking more seriously.
What if there isn’t going to be a traditional “recovery”?
Not a crash.
Not another boom.
Just years of relatively flat prices, regional divergence and modest long-term growth.
Cotality recently argued that focusing constantly on the distance from the COVID-era peak may itself distort our understanding of the market.
Its longer-term numbers put compound property-value growth at roughly 3.4% per annum over the past decade.
That’s a very different world from the assumption that residential property automatically doubles every seven to ten years.
Perhaps the pandemic boom was the anomaly.
Perhaps what we’re seeing now isn’t simply the painful waiting room before the next explosive upswing.
Perhaps this is the new normal.
The numbers tell the story
| August 2026 indicator | Result |
|---|---|
| National sales | 5,430 |
| Sales vs Aug 2025 | -13% |
| August sales ranking | 6th-lowest in 35 years |
| National HPI YoY | -0.9% |
| National values from peak | -17.1% |
| Auckland days to sell | 54 |
| Auckland 10-year Aug average | 43 |
| Auckland from peak | Almost -25% |
| Wellington days to sell | 60 |
| Wellington 10-year Aug average | 41 |
| Wellington from peak | -30.3% |
| Homes currently for sale* | 32,908 |
| Stock vs three years ago* | +45% |
| Cotality August value movement | -0.4% |
| Consecutive Cotality monthly falls | 5 months |
*realestate.co.nz listing data.
The Property Noise view
Calling this a property-market crash would be sensationalist.
It isn’t.
There are regions performing well, prices nationally aren’t collapsing, first-home buyers are active and some of the worst affordability pressures of the boom have eased.
But continually talking about an imminent “recovery” risks being equally misleading.
Auckland properties taking a record 54 days to sell in August isn’t recovery.
Wellington taking 60 days isn’t recovery.
National sales dropping 13% isn’t recovery.
Five consecutive monthly declines in Cotality’s national value index isn’t recovery.
And Auckland and Wellington remaining roughly 25% and 30% below their respective peaks certainly doesn’t resemble the rebound many homeowners were promised.
What we have instead is something much less dramatic — but potentially much more consequential.
A buyer’s market.
Plenty of stock.
Plenty of choice.
Little urgency.
And almost no FOMO.
For first-home buyers with secure employment and finance approved, that could represent a rare opportunity.
For vendors?
Welcome to the market where buyers have learned they can wait.
And until that changes, Auckland and Wellington’s great property-market recovery may remain exactly where it has been for the past few years:
just around the corner.