

New Zealand recorded 5,752 residential sales in September, with fewer transactions than a year earlier, more homes available and longer annual selling times. Auckland drove much of the decline — while the House Price Index revealed a clear divide between the North and South Islands.
PROPERTY NOISE | NEWS & MARKET ANALYSIS
14 October 2026
Spring has arrived. A broad housing-market recovery has yet to follow.
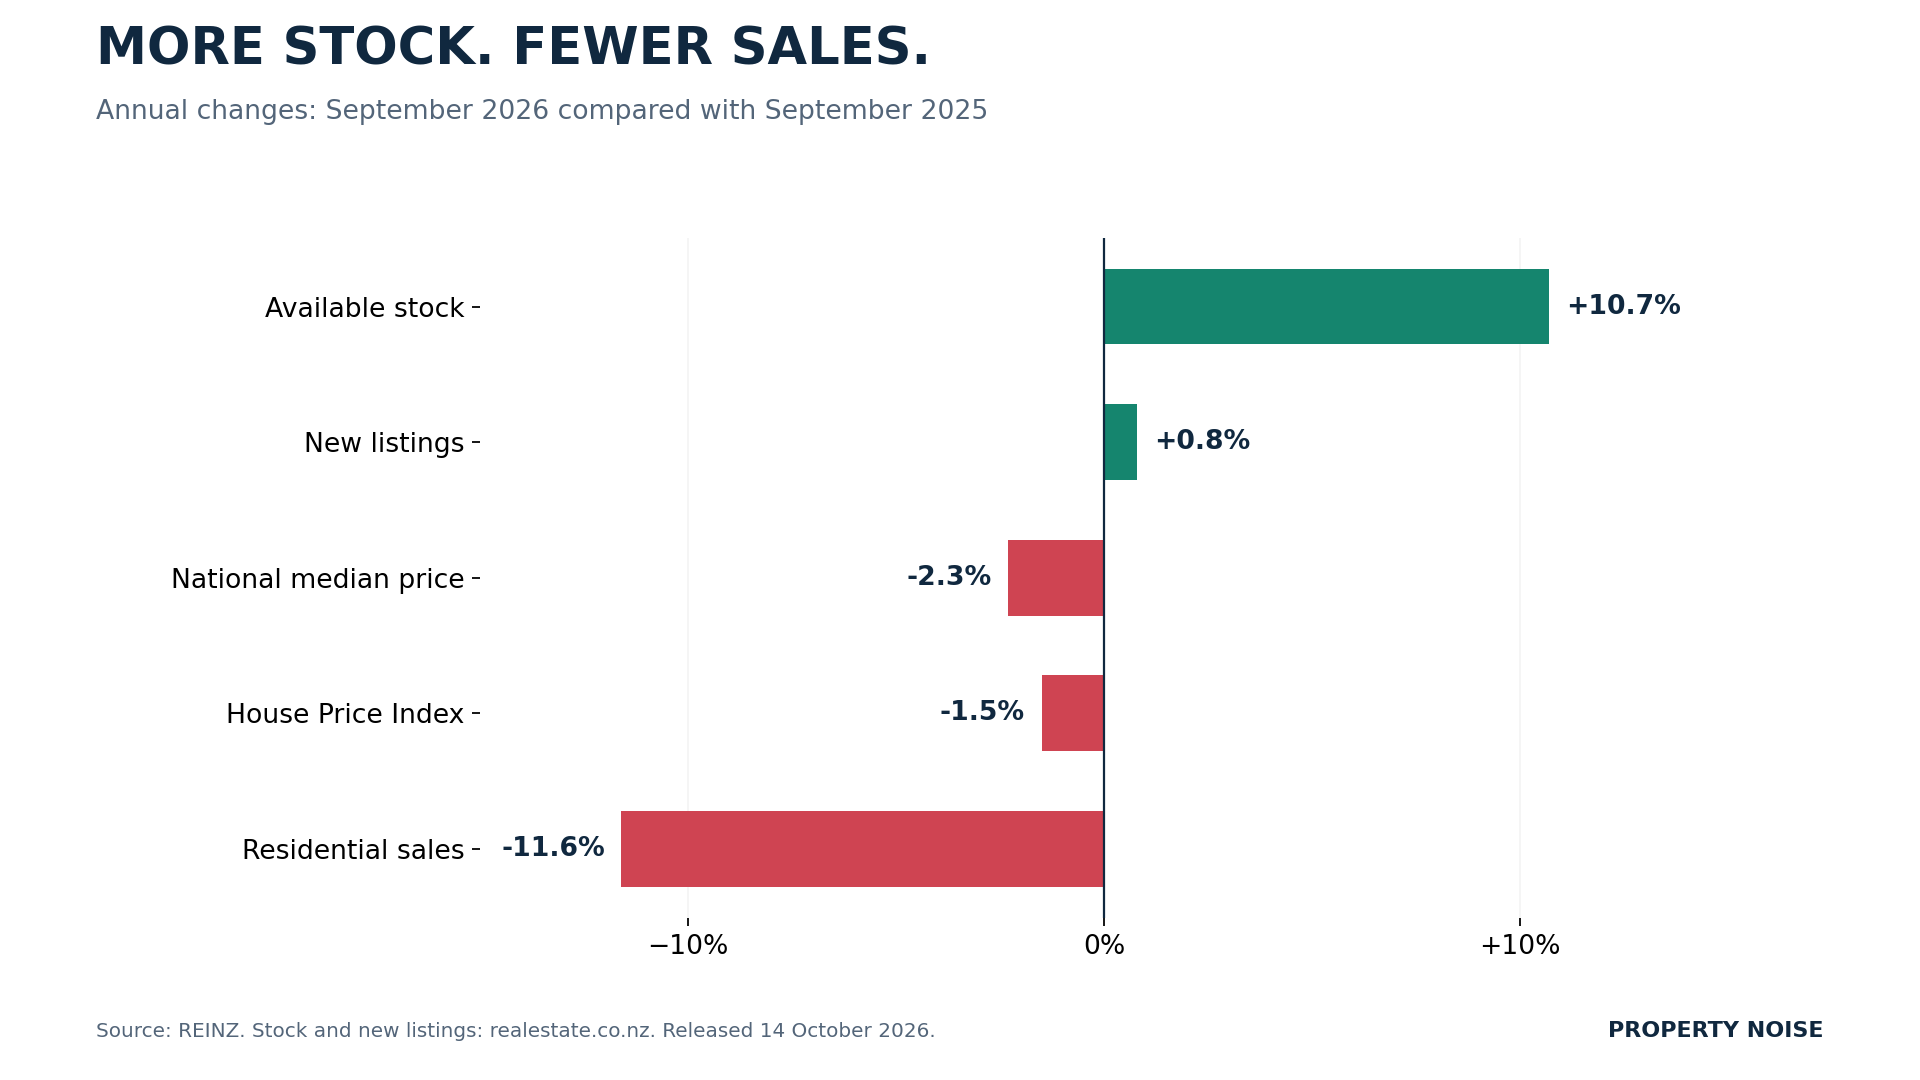
The latest REINZ New Zealand Property Report shows residential sales fell 11.6% year-on-year in September 2026, while available stock increased 10.7%.
The national median sale price was $755,000, down 2.3% from September last year. The REINZ House Price Index, which provides a different measure of price movement, declined 1.5% annually.
There were encouraging results in particular markets. Properties also sold faster than in August.
But the seasonally adjusted figures provide the clearest challenge to claims of a national spring resurgence: sales fell 4.3% from the previous month after accounting for normal seasonal patterns.
For vendors waiting for warmer weather to strengthen their negotiating position, that is an uncomfortable result.
REINZ SEPTEMBER 2026: THE KEY NUMBERS
| Measure | September 2026 | Compared with September 2025 |
|---|---|---|
| National median sale price | $755,000 | Down 2.3% |
| Median price excluding Auckland | $691,200 | Effectively unchanged |
| Residential sales | 5,752 | Down 11.6% |
| REINZ House Price Index | 3,551 | Down 1.5% |
| Available inventory | 34,001 properties | Up 10.7% |
| New listings | 9,466 | Up 0.8% |
| Median days to sell | 46 days | Three days longer |
Source: REINZ September 2026 Property Report, published 14 October. Inventory and new-listing data are supplied by realestate.co.nz.
These measures describe different parts of the market.
Prices indicate what sold properties achieved. Sales counts measure transaction activity. Inventory shows the stock available to purchasers.
Taken together, they suggest modest national price easing alongside a more substantial weakness in turnover.
SALES ROSE FROM AUGUST — BUT THAT NEEDS CONTEXT
September’s 5,752 sales were 2.3% higher than August’s revised total of 5,624.
That is an improvement in the raw count. However, REINZ’s seasonally adjusted calculation shows a 4.3% monthly decline.
The distinction matters because activity normally changes through the year. A September increase can still fall short of the usual seasonal pattern.
REINZ says the customary spring lift was yet to arrive.
There is also an important update for readers following earlier reports: the September publication revises August’s sales total to 5,624. Property Noise’s original August REINZ analysis used the 5,430 figure available at that time.
REINZ explains that late reporting and corrections can change previous results. Current monthly comparisons should use the revised figures in the latest publication.
A SOFT SEPTEMBER — BUT NOT A RECORD LOW
REINZ places September’s sales count as the 12th-lowest of the 35 Septembers in its records.
That means 11 recorded Septembers had fewer sales.
The result sits towards the lower end of the historical range, but it is well above the weakest September outcomes.
This is a subdued transaction market. Describing the figures as a record collapse would overstate them.
Equally, a raw improvement from August does not establish a strong recovery when sales remain below last year and the seasonally adjusted result has weakened.
The useful story sits in those distinctions.
AUCKLAND ACCOUNTED FOR MORE THAN HALF THE ANNUAL SALES DECLINE
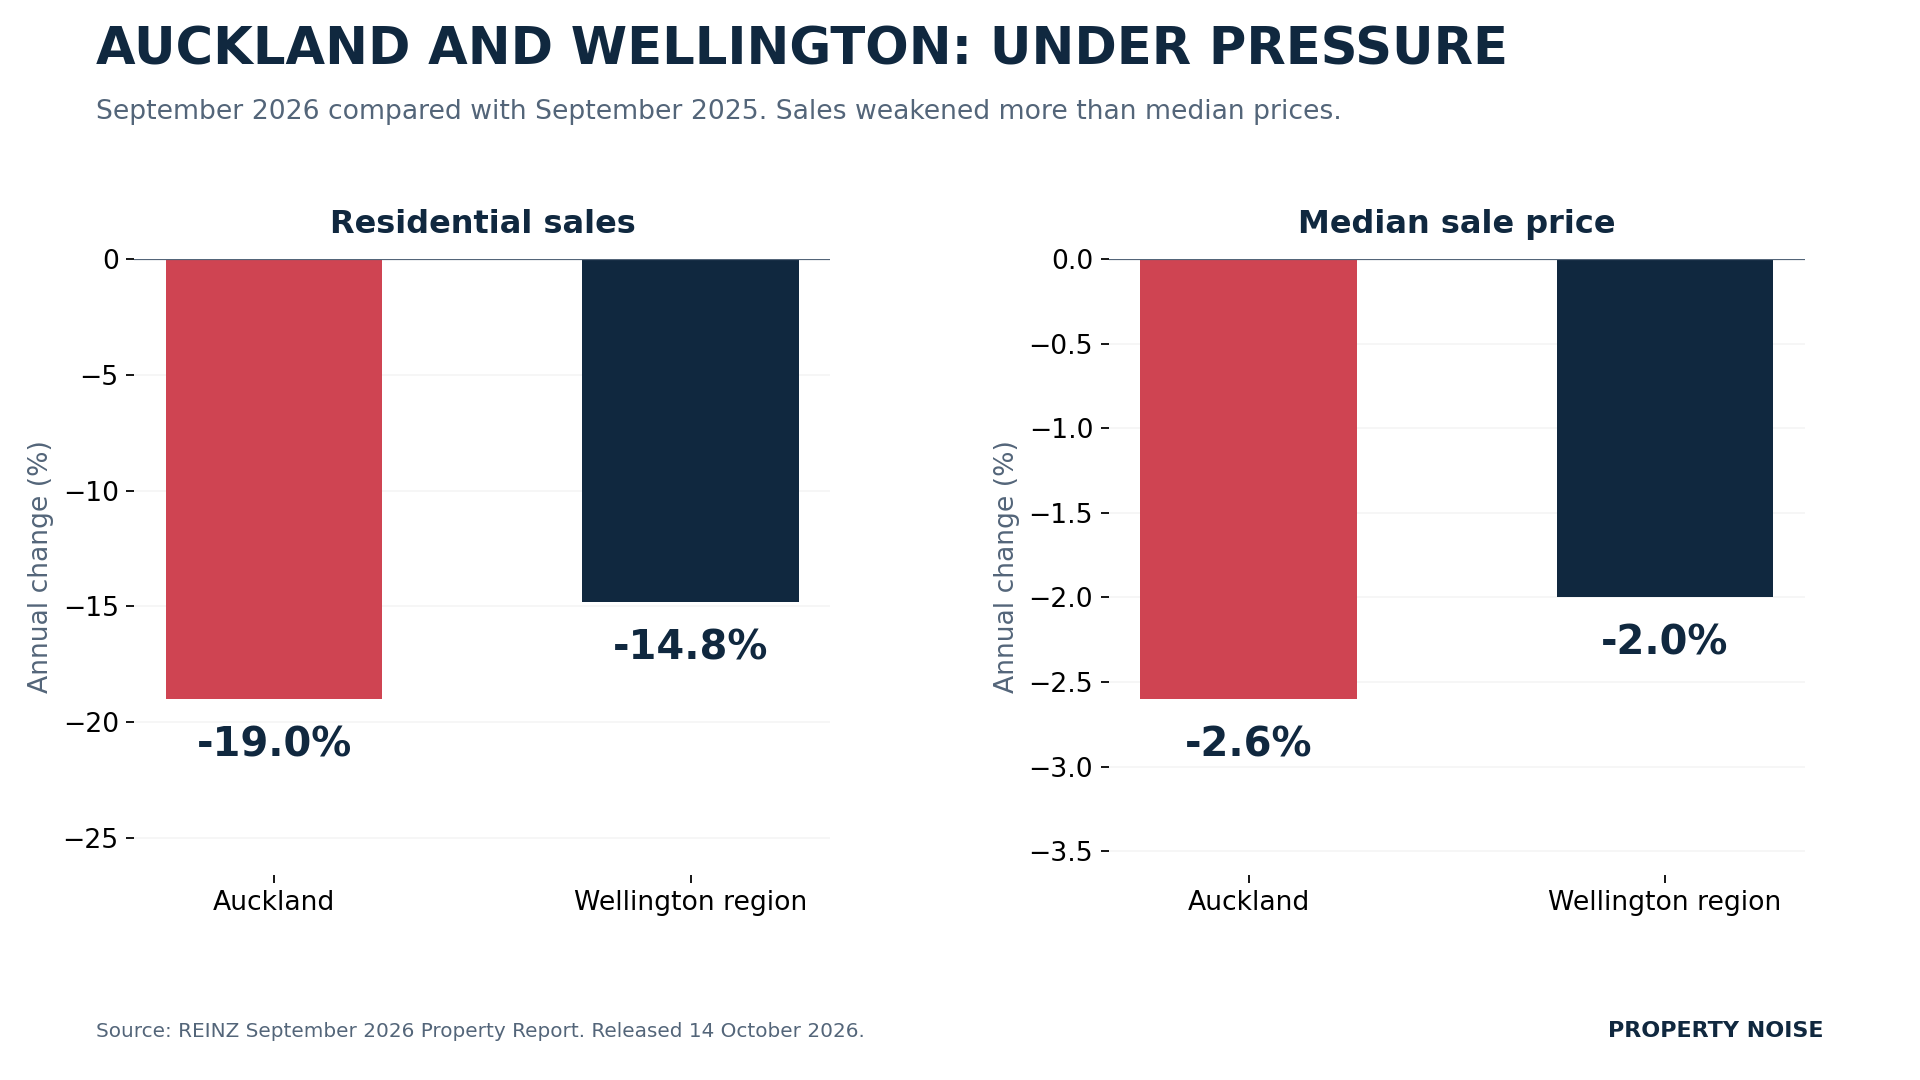
Auckland recorded 1,664 residential sales, down 19.0% from September 2025.
The region accounted for 391 of the national annual decline of 754 transactions — approximately 52% of the reduction.
Its other indicators were also softer:
- Median sale price: $950,000, down 2.6% annually.
- House Price Index: down 3.2% annually.
- Median selling time: 47 days, four days longer than a year earlier.
- Seasonally adjusted sales: down 13.6% from August.
- New listings: 3,581, up 7.7% annually.
More new listings alongside fewer annual sales creates a demanding environment for vendors seeking attention.
A home needs a convincing proposition relative to competing properties. Its price, condition and suitability all matter.
Property Noise examined an earlier agency-specific signal in Auckland housing market: Barfoot sales fall 26% as buyers face more choice.
The REINZ report covers a broader set of reported residential transactions, so its figures should not be confused with one agency’s results.
WELLINGTON IMPROVES MONTHLY WHILE REMAINING WEAK ANNUALLY
The Wellington region recorded 513 sales, down 14.8% year-on-year.
REINZ says this was the region’s third-lowest September sales count.
The regional median was $745,000, down 2.0% annually, and properties took a median 52 days to sell.
There were improvements from August: raw sales rose 9.1%, the median price increased 4.9%, and selling time shortened by 11 days.
Yet seasonally adjusted sales fell 0.8%.
Wellington City itself recorded 192 sales, down 13.9% annually, with a median price of $821,000, down 5.7%.
REINZ’s local commentary describes stronger open-home attendance and increased appraisal activity, alongside limited investor participation.
Those are encouraging signs of engagement. They have not yet translated into a strong annual sales result.
THE NORTH–SOUTH DIVIDE IS CLEAREST IN THE HOUSE PRICE INDEX
One of the report’s most significant findings is the direction of its regional HPI series.
All four South Island HPI series increased year-on-year. All eight North Island series declined.
Southland led annual HPI growth for the 14th consecutive month.
However, Southland’s median sale price fell 3.8% annually to $505,000.
That apparent contradiction illustrates why median prices and the HPI should be considered separately.
A median is the midpoint of the prices achieved by the properties sold during a period. It can change when the composition of those sales changes.
The HPI is designed to account for differences in the properties transacting.
Neither measure means every individual home experienced precisely the reported movement.
TARANAKI’S 11.4% MEDIAN RISE NEEDS THE SAME CARE
Taranaki recorded the strongest annual regional median increase: 11.4% to $620,000, from 153 sales.
But its HPI fell 3.0% annually, and properties took 18 days longer to sell than a year earlier.
A headline based only on the median would miss that context.
The West Coast provides another example. Its median rose 4.7% annually to $450,000, but the result came from just 27 sales, with transaction numbers down 40.0%.
Smaller transaction pools can produce volatile median movements.
For sellers, the relevant question remains what comparable properties have recently achieved.
MANAWATŪ-WHANGANUI OFFERS AN ACTIVITY BRIGHT SPOT
Manawatū-Whanganui recorded the largest percentage annual sales increase among the regions: 8.2%, reaching 330 transactions.
Seasonally adjusted sales increased 2.2% from August.
Its median price was $535,000, down 0.9% annually, demonstrating that improved activity can coexist with slightly softer prices.
Within Horowhenua, sales increased from 39 to 52, a 33.3% annual rise. The district’s median fell 9.3% to $515,000.
Those figures show more properties changing hands. They do not establish that every Horowhenua home lost 9.3% of its value.
34,001 HOMES AVAILABLE: THE COMPETITION SELLERS FACE
National inventory rose 10.7% year-on-year to 34,001 properties.
New listings increased by a much smaller 0.8% to 9,466.
Together, those figures indicate elevated available stock while properties take longer to sell than a year earlier.
The pattern is not universal. Southland’s inventory fell 8.4% annually, which REINZ attributes to fewer new listings rather than rising sales.
Gisborne’s inventory increased 62.1%, but from a small base: 103 to 167 properties.
For a vendor, competing stock matters because buyers can compare alternatives and take time over a decision.
For buyers, choice is useful. It does not remove the need to investigate condition, title, financing and ownership costs.
WHAT DOES THIS MEAN FOR AGENTS AND VENDORS?
REINZ’s figures reinforce the value of realistic, locally supported advice.
A successful campaign needs more than reassurance that spring traditionally brings purchasers.
Vendors should ask which comparable properties have sold, what competing homes offer and what buyer feedback would justify a change in strategy.
Agents need to distinguish enquiries from purchasers able and willing to proceed.
The commercial pressure on the profession is explored in Property Noise’s Too many agents, not enough sales? The numbers behind NZ real estate’s brutal 2026.
Meanwhile, our report on first-home buyers stepping up while investors stay away provides context for the differing participation of buyer groups.
THE PROPERTY NOISE VIEW
REINZ’s September report contains genuine regional strengths.
It also contains a clear national warning: fewer annual sales, more available stock and a spring increase that disappears after seasonal adjustment.
Prices have eased more modestly than transaction activity. That is an important distinction.
A housing market can remain subdued without experiencing a nationwide crash. Some regions can perform well while the national picture stays weak.
Property Noise’s latest analysis of QV’s buyer-dominated market approaches the issue through a different dataset. The measures should remain separate, but both reports give vendors reasons to examine current local evidence carefully.
September brought 5,752 sales. It did not establish the broad spring recovery many sellers were waiting for.
Are vendors adjusting to today’s market — or still waiting for yesterday’s prices?
Source: REINZ New Zealand Property Report, September 2026, published 14 October 2026. Figures relate to reported residential sales becoming unconditional. Inventory and listing data are courtesy of realestate.co.nz. Additional interpretation by Property Noise.