
PHOTO: The NZ Property ‘Recovery’ Is Losing Momentum. Jakub Zerdzicki – PEXELS
New Zealand’s much-discussed housing recovery is looking increasingly difficult to find, with fresh QV data showing residential property values falling across most of the country — and the rate of decline accelerating as buyers retreat.
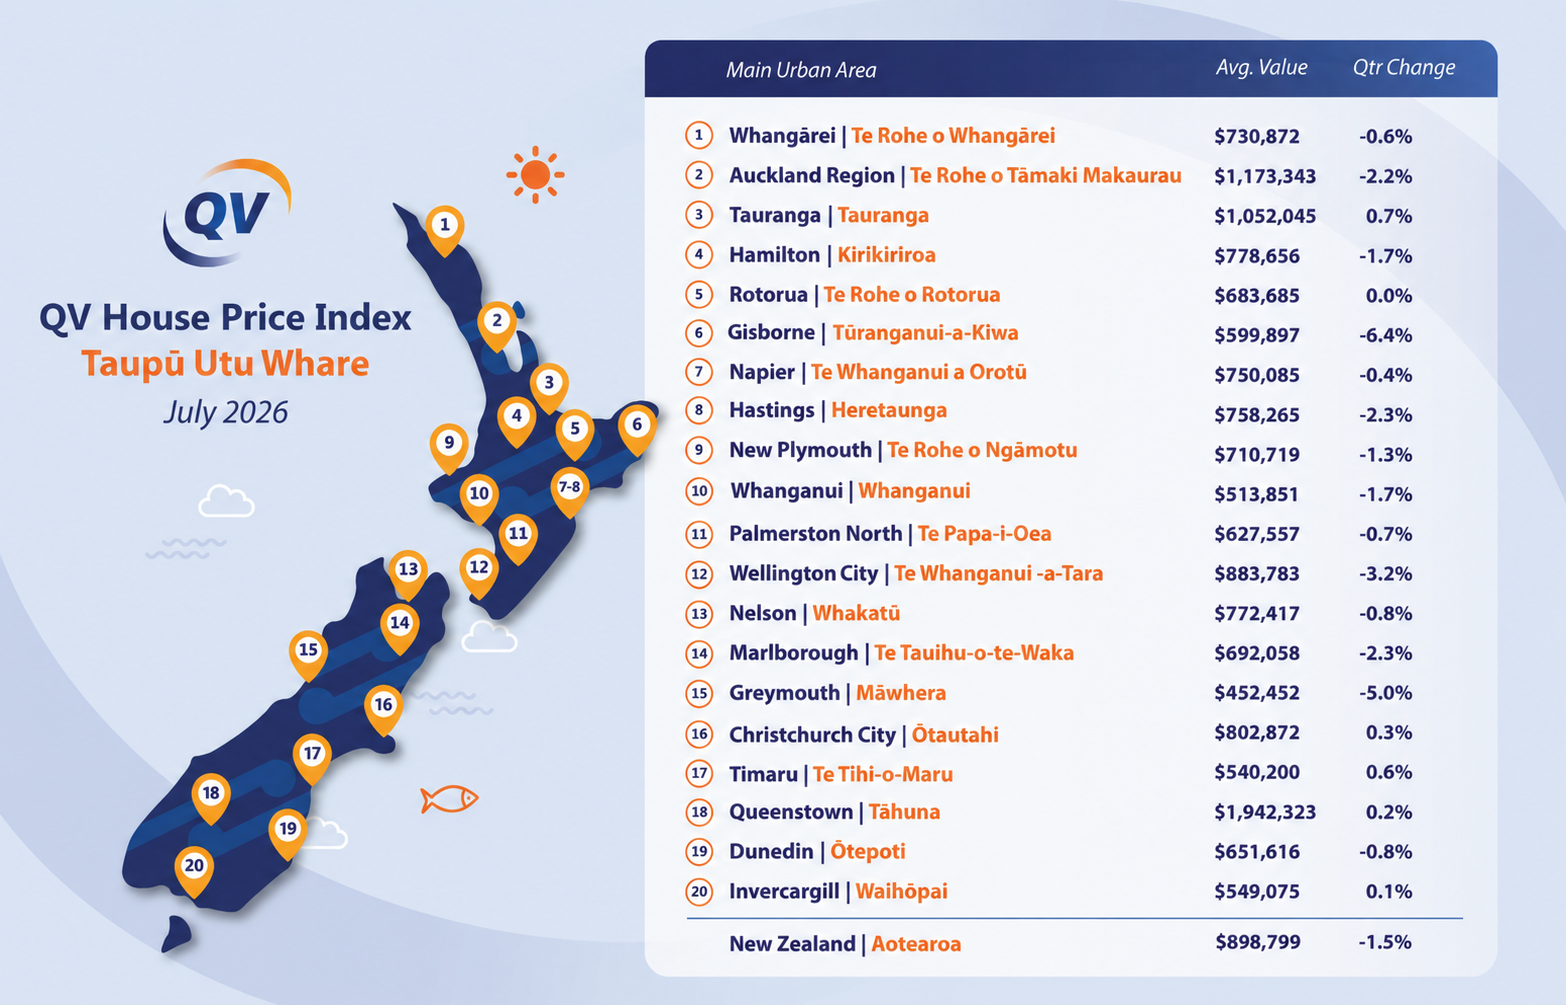
The latest QV House Price Index, released on 10 August, shows the national average residential property value fell 1.5% during the three months to the end of July 2026, leaving the average home valued at $898,799.
That follows a considerably smaller 0.4% three-month decline to the end of June, suggesting the weakness evident earlier in winter has intensified.
And this isn’t simply an Auckland story.
QV’s assessment is particularly significant because the modest momentum seen earlier in 2026 has now faded.
For anyone repeatedly hearing that the New Zealand property market is recovering, the latest numbers deserve a very close look.
The NZ Property ‘Recovery’ Is Losing Momentum
The national headline is stark:
NZ average residential value: $898,799
Three-month movement: -1.5%
QV says average values declined across most of New Zealand during the latest three-month period.
That 1.5% movement may not sound dramatic compared with the enormous swings experienced during the pandemic property boom and subsequent correction.
But direction matters.
Only one month ago, QV reported national values had declined 0.4% over the three months to June.
Now it’s 1.5%.
That’s a notable deterioration.
QV spokesperson Simon Petersen summed up the situation particularly well, describing it not as another dramatic correction, but as a subdued market losing the limited momentum it had generated earlier in 2026.
In other words:
The market tried to get going — and appears to be stalling again.
Gisborne Property Values Plunge 6.4%
Some regional movements are far more severe than the national average.
According to QV’s July figures supplied with the report, the largest three-month declines included:
| Location | 3-month change |
|---|---|
| Gisborne | -6.4% |
| Greymouth | -5.0% |
| Wellington City | -3.2% |
| Marlborough | -2.3% |
| Hastings | -2.3% |
| Auckland | -2.2% |
| Hamilton | -1.7% |
| Whanganui | -1.7% |
A 6.4% three-month decline in Gisborne isn’t insignificant.
Nor is 5% in Greymouth.
And Wellington’s housing problems clearly haven’t disappeared either, with the capital recording another sizeable fall.
Auckland House Prices Fall Another 2.2%
Then there’s Auckland.
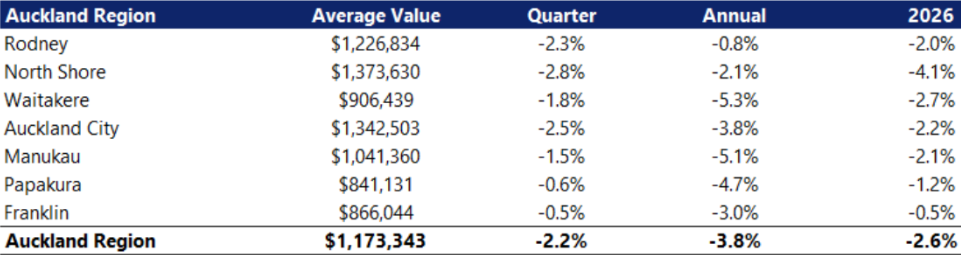
New Zealand’s largest and most valuable housing market recorded a 2.2% decline over the three months to July.
That matters nationally.
Auckland carries enormous weight within New Zealand’s housing market, and sustained weakness there makes a convincing nationwide property recovery considerably harder to achieve.
Earlier REINZ data had already shown Auckland’s House Price Index 1.2% lower year-on-year in March, even while the national figure was marginally positive.
Now QV’s latest figures show another clear short-term deterioration.
Anyone waiting for Auckland to lead the next national property boom may be waiting a while longer.
Wellington’s Property Hangover Continues
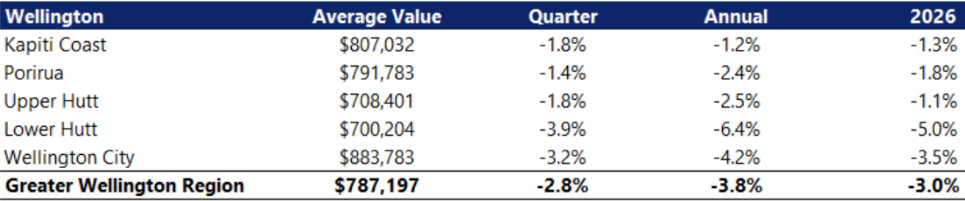
Wellington City was another major loser.
Average values fell 3.2% in just three months.
The latest QV result indicates the market remains under considerable pressure.
A property worth $1 million that experienced a 3.2% decline would, mathematically, lose around $32,000 in value.
That’s not an insignificant amount of household equity.
There Are Still Some Winners
This isn’t a universal property collapse, and that’s important.
A small number of centres recorded growth over the three months to July:
Tauranga: +0.7%
Timaru: +0.6%
Christchurch: +0.3%
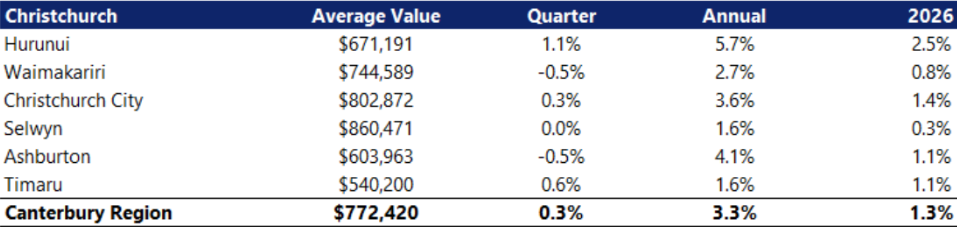
Queenstown: +0.2%
Invercargill: +0.1%
Rotorua was unchanged.
But look at those increases.
Even the strongest performer among those listed — Tauranga — managed just 0.7% growth over three months.
That’s hardly evidence of a nationwide boom gathering momentum.
QV has been warning for months that New Zealand has developed into a highly fragmented or “patchwork” property market, with parts of the South Island outperforming many northern centres.
July suggests even those bright spots are becoming fewer.
And There’s Another Problem: Buyers Have Plenty of Choice
The QV numbers become even more interesting when combined with the latest listing data.
Realestate.co.nz reported 33,252 properties available for sale at the end of July.
That’s 9.3% more than a year earlier.
So consider the combination now confronting vendors:
Property values falling.
Stock 9.3% higher.
Buyers cautious.
Borrowing-cost uncertainty.
Economic uncertainty.
Spring approaching.
That isn’t an especially seller-friendly equation.
33,252 Homes Are Already for Sale Before Spring
This may prove to be one of the most important housing-market numbers heading into the remainder of 2026.
There are already more than 33,000 homes available for sale nationally.
And we’re only just approaching the traditional spring selling season.
Spring normally brings more properties onto the market.
If fresh listings arrive faster than existing stock is absorbed, vendors will increasingly be competing against other vendors for a finite pool of buyers.
That can create pressure on price expectations.
Realestate.co.nz’s own July commentary acknowledges the reality underneath the headline numbers: vendors who adapt to today’s market are achieving results, while those holding onto yesterday’s price expectations risk being left behind.
That’s a polite way of saying:
Price it realistically — or it may sit there.
The Property Industry’s Optimism Deserves Scrutiny
This is where Property Noise believes consumers should distinguish carefully between property data and property marketing.
Earlier this year, parts of the industry were understandably keen to highlight signs of renewed activity.
In April, realestate.co.nz reported that activity had returned to 2021 levels in some respects and highlighted a 14% year-on-year increase in enquiries.
As recently as late July, realestate.co.nz argued that listings had continued climbing while prices were holding.
Yet QV’s valuation data now paints a considerably colder picture.
National values:
Down 0.4% over the three months to June.
Then:
Down 1.5% over the three months to July.
Those datasets measure different things, so they aren’t inherently contradictory. Asking prices, sales activity and property valuations should never be treated as interchangeable.
But consumers deserve to see all of them.
Asking Price Isn’t the Same as Property Value
This distinction is crucial.
Realestate.co.nz tracks asking prices — what sellers are seeking when properties are advertised.
QV’s House Price Index tracks changes in residential property values.
REINZ provides another perspective through actual transactions and its House Price Index.
One can therefore produce an apparently stable asking-price story while another records declining underlying values.
That’s exactly why homeowners shouldn’t base major financial decisions on a single headline declaring that the market is “back”.
Higher Borrowing Costs Could Change the Equation Again
QV also points directly to borrowing costs as part of the latest deterioration in sentiment.
The Reserve Bank increased the OCR to 2.50% in July, changing the interest-rate narrative after the earlier easing cycle.
For property, interest rates matter enormously.
They affect:
- How much purchasers can borrow
- Mortgage servicing costs
- Investor calculations
- Buyer confidence
- Household disposable income
- The price buyers can ultimately afford to offer
Property prices don’t exist independently of credit.
If money becomes more expensive, purchasers’ budgets can shrink.
And when buyers already have thousands of properties to choose from, they have less incentive to chase a vendor’s price.
This Is Not 2021
That’s perhaps the most important message.
The psychology of today’s property market bears little resemblance to the frenzy of 2020 and 2021.
Back then, many buyers feared that if they didn’t purchase today, the same house would cost considerably more tomorrow.
That fear helped drive competition.
Today’s buyer can often afford to wait.
There may be another comparable property next week.
Or next month.
And if values are drifting down rather than rapidly appreciating, waiting can actually appear financially rational.
That’s a fundamental shift in market psychology.
What Would Turn the NZ Housing Market Around?
For a strong, sustained national recovery, New Zealand probably needs some combination of:
Stronger household confidence
Improving economic conditions
Stable or falling mortgage rates
Employment security
Higher buyer demand
Inventory absorption
Population growth translating into purchasing demand
And most importantly:
Buyers willing and able to pay higher prices.
Until that final component arrives, property-market optimism alone won’t push valuations higher.
Property Noise Take: Stop Calling Every Pulse a Recovery
New Zealand property isn’t collapsing uniformly.
Let’s make that clear.
Christchurch remains comparatively resilient.
Tauranga increased.
Queenstown remains an entirely different market from Wellington.
Regional variation is substantial.
But the national direction in QV’s latest data is impossible to ignore.
The three-month national movement has deteriorated from -0.4% in June to -1.5% in July.
Auckland is down 2.2%.
Wellington City is down 3.2%.
Gisborne is down 6.4%.
And more than 33,000 properties are already competing for buyers nationally.
So perhaps it’s time to retire the automatic “recovery” narrative every time sales volumes improve for a month or buyers turn up at open homes.
Activity isn’t the same as price growth.
Enquiries aren’t sales.
Listings aren’t demand.
Asking prices aren’t valuations.
And a housing recovery ultimately requires purchasers willing to pay increasingly higher prices.
Right now, QV’s numbers tell us the opposite is occurring across much of New Zealand.
The Bottom Line
The New Zealand property market enters the second half of 2026 in a much weaker position than many hoped for at the beginning of the year.
The national average residential value is now $898,799, with values falling 1.5% over the latest three-month period.
At the same time, property stock is 9.3% higher than a year ago, leaving buyers with substantial choice.
This isn’t necessarily the beginning of another 2022-style property crash.
QV itself isn’t describing it that way.
But neither is it the convincing recovery many property owners have been waiting for.
The market isn’t roaring back.
If anything, the latest evidence suggests the small amount of momentum it had is disappearing.
And with spring about to bring another potential wave of listings, the real test for New Zealand property may only just be beginning.