








PHOTO: When will the spin stop – and the industry start calling the New Zealand housing market what the numbers say it is?
PROPERTY NOISE NZ | OPINION & MARKET ANALYSIS
There comes a point when the language used to describe a property market starts sounding increasingly disconnected from the market itself.
That point may have arrived.
REINZ released its August 2026 figures today under the headline:
“National prices steady amid slower activity and regional variation.”
Technically, REINZ can defend the word steady. Its House Price Index was down only 0.9% year-on-year, while the national median price declined 1.3%.
But step away from the headline and look at the rest of REINZ’s own numbers.
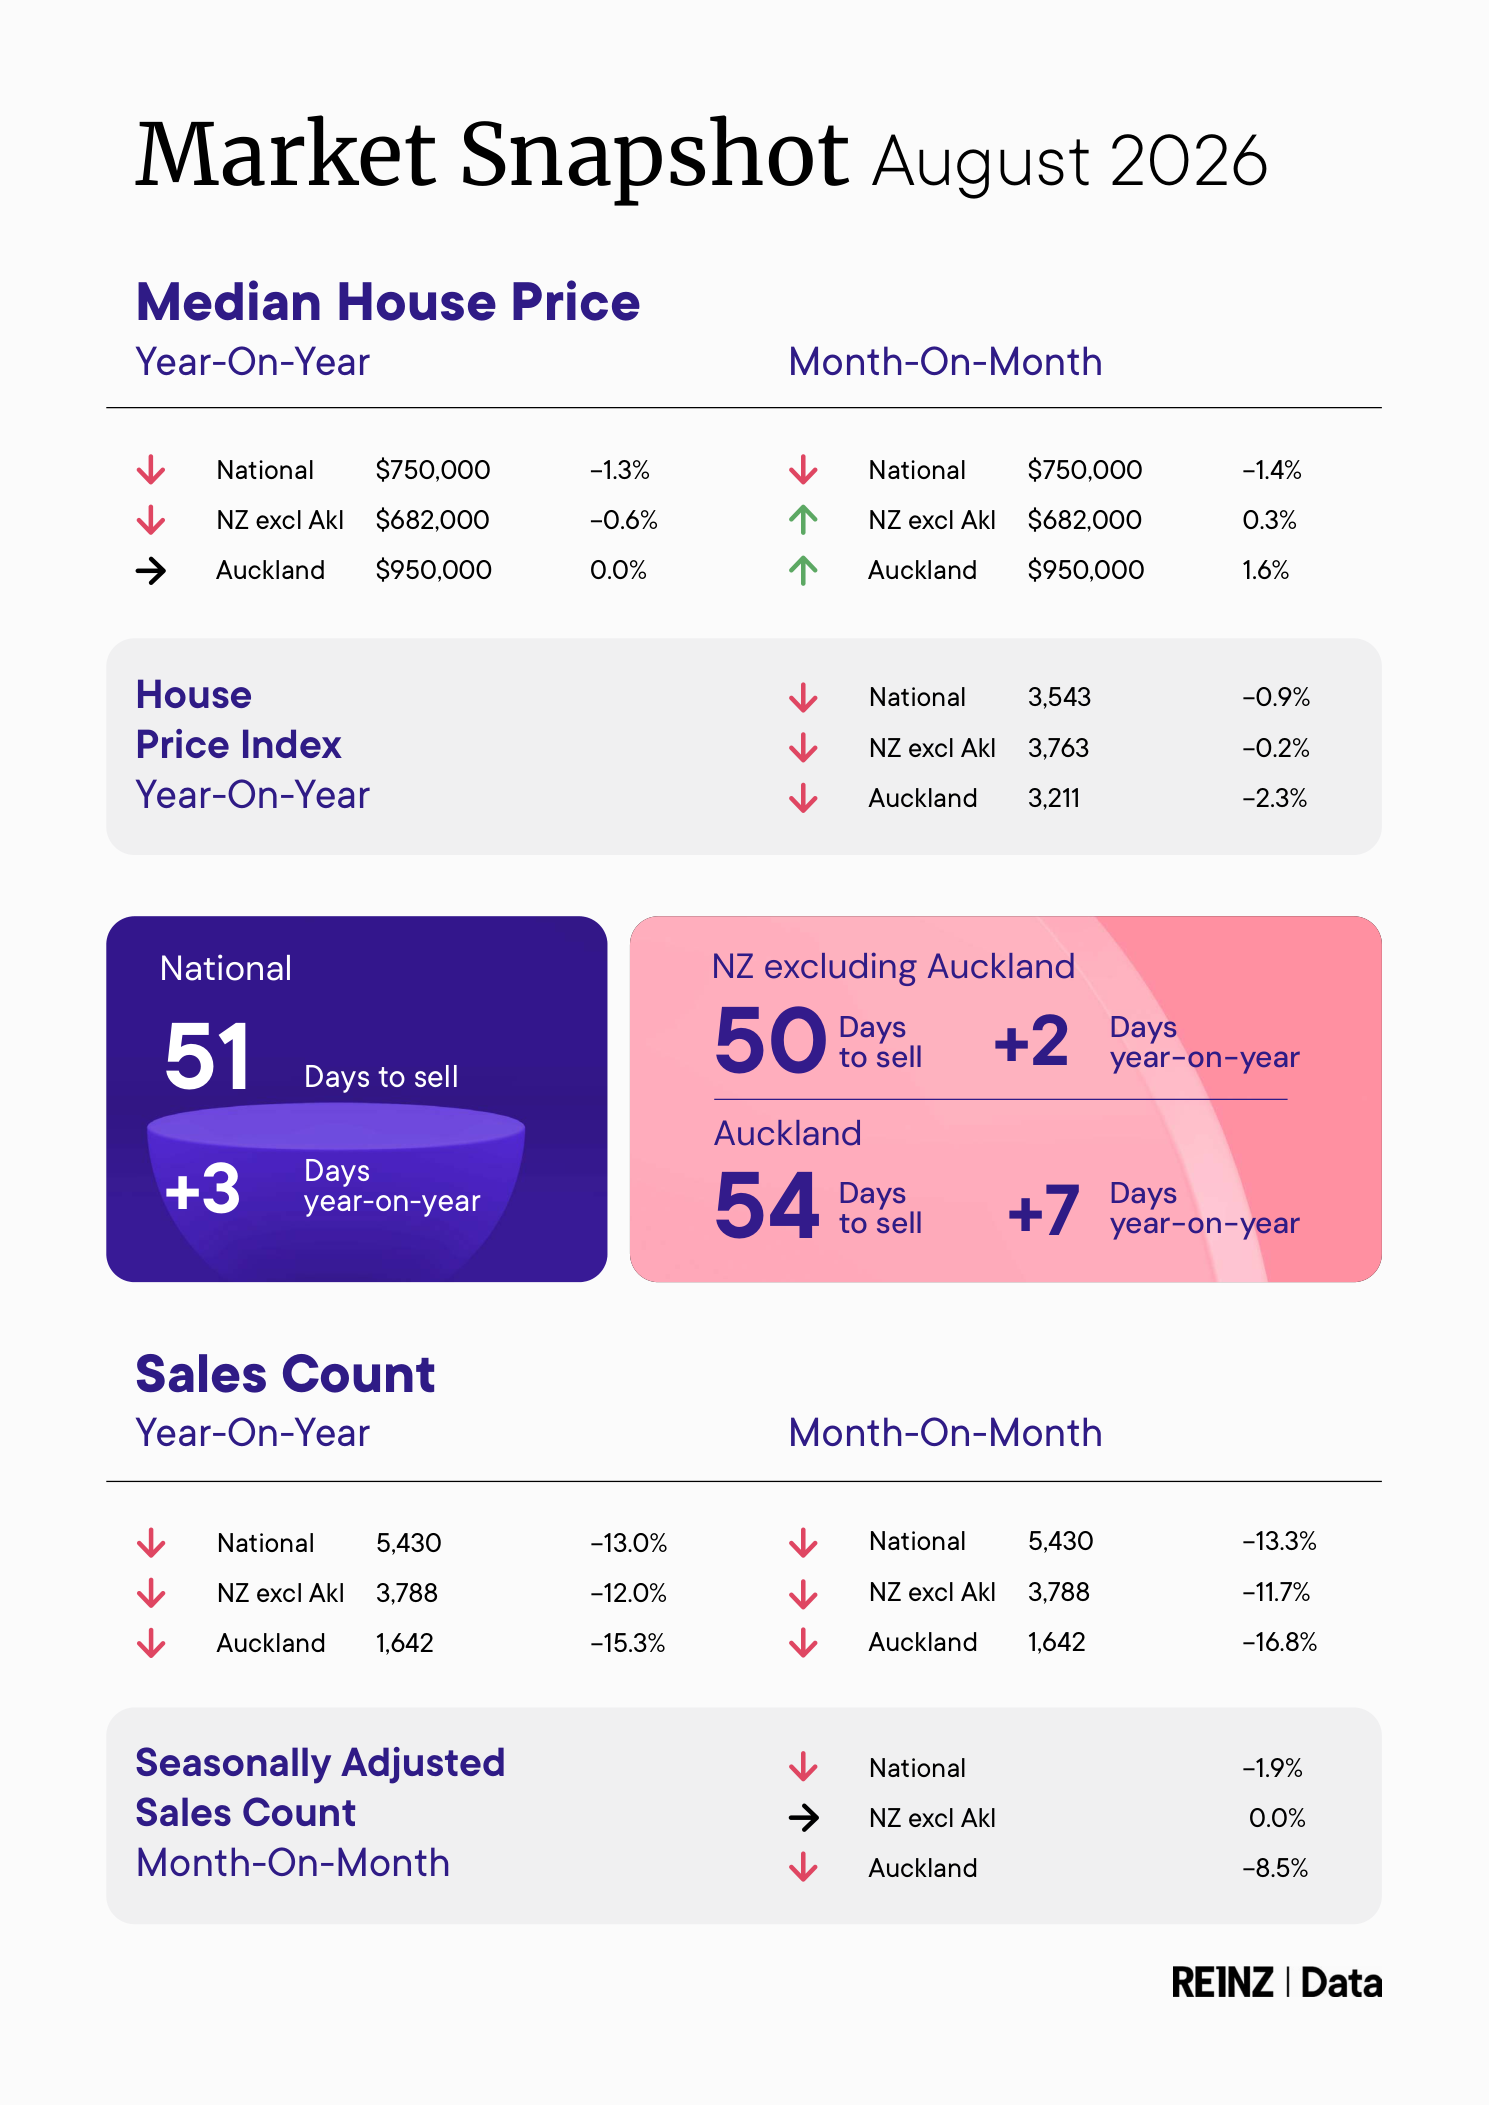
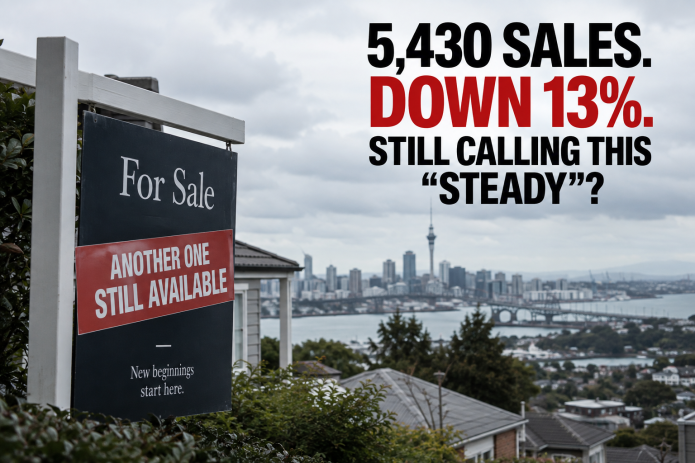
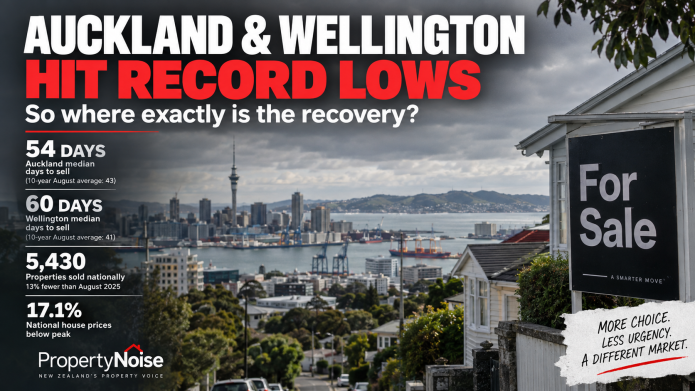
5,430 homes sold.
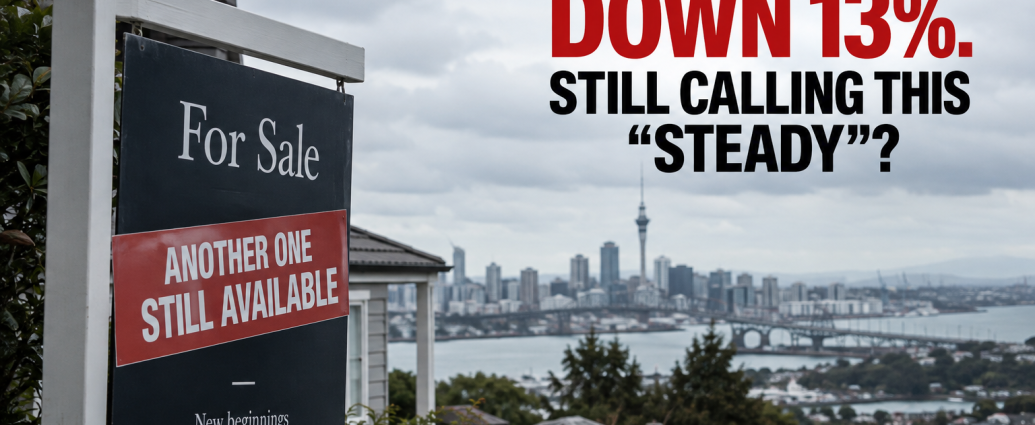
Sales down 13%.
Sixth-lowest August sales total in 35 years.
51 days to sell.
Fourth-highest August selling time on record.
Inventory up 9.7%.
New listings down 5.1%.
13 of 16 regions recorded fewer sales than a year ago.
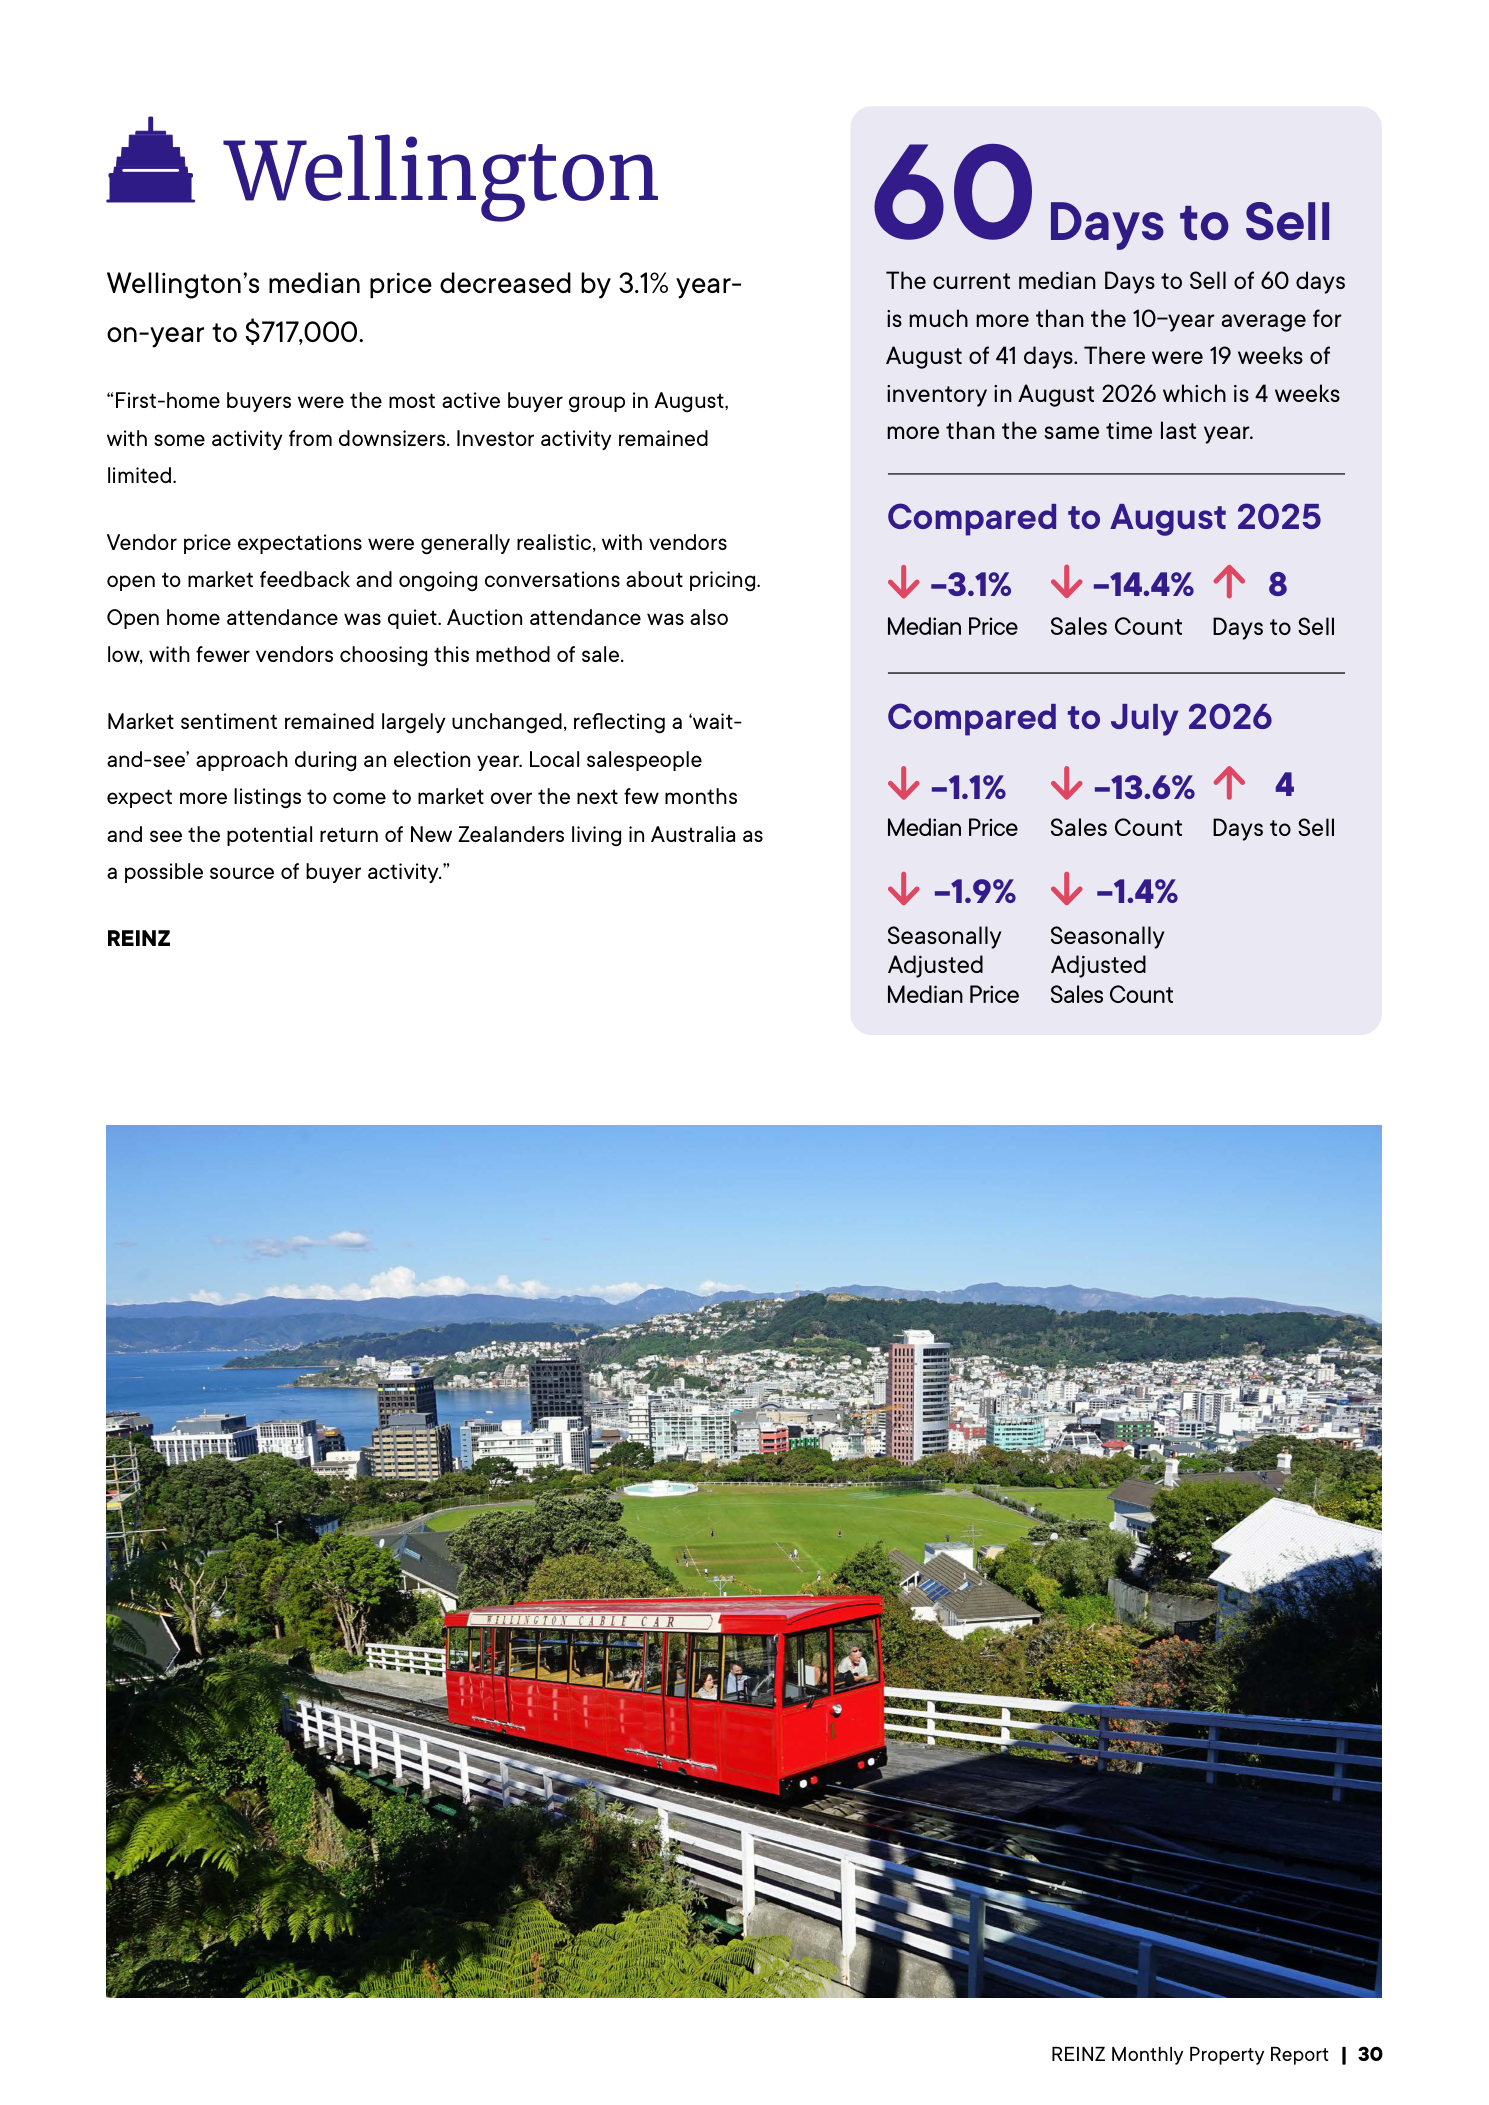
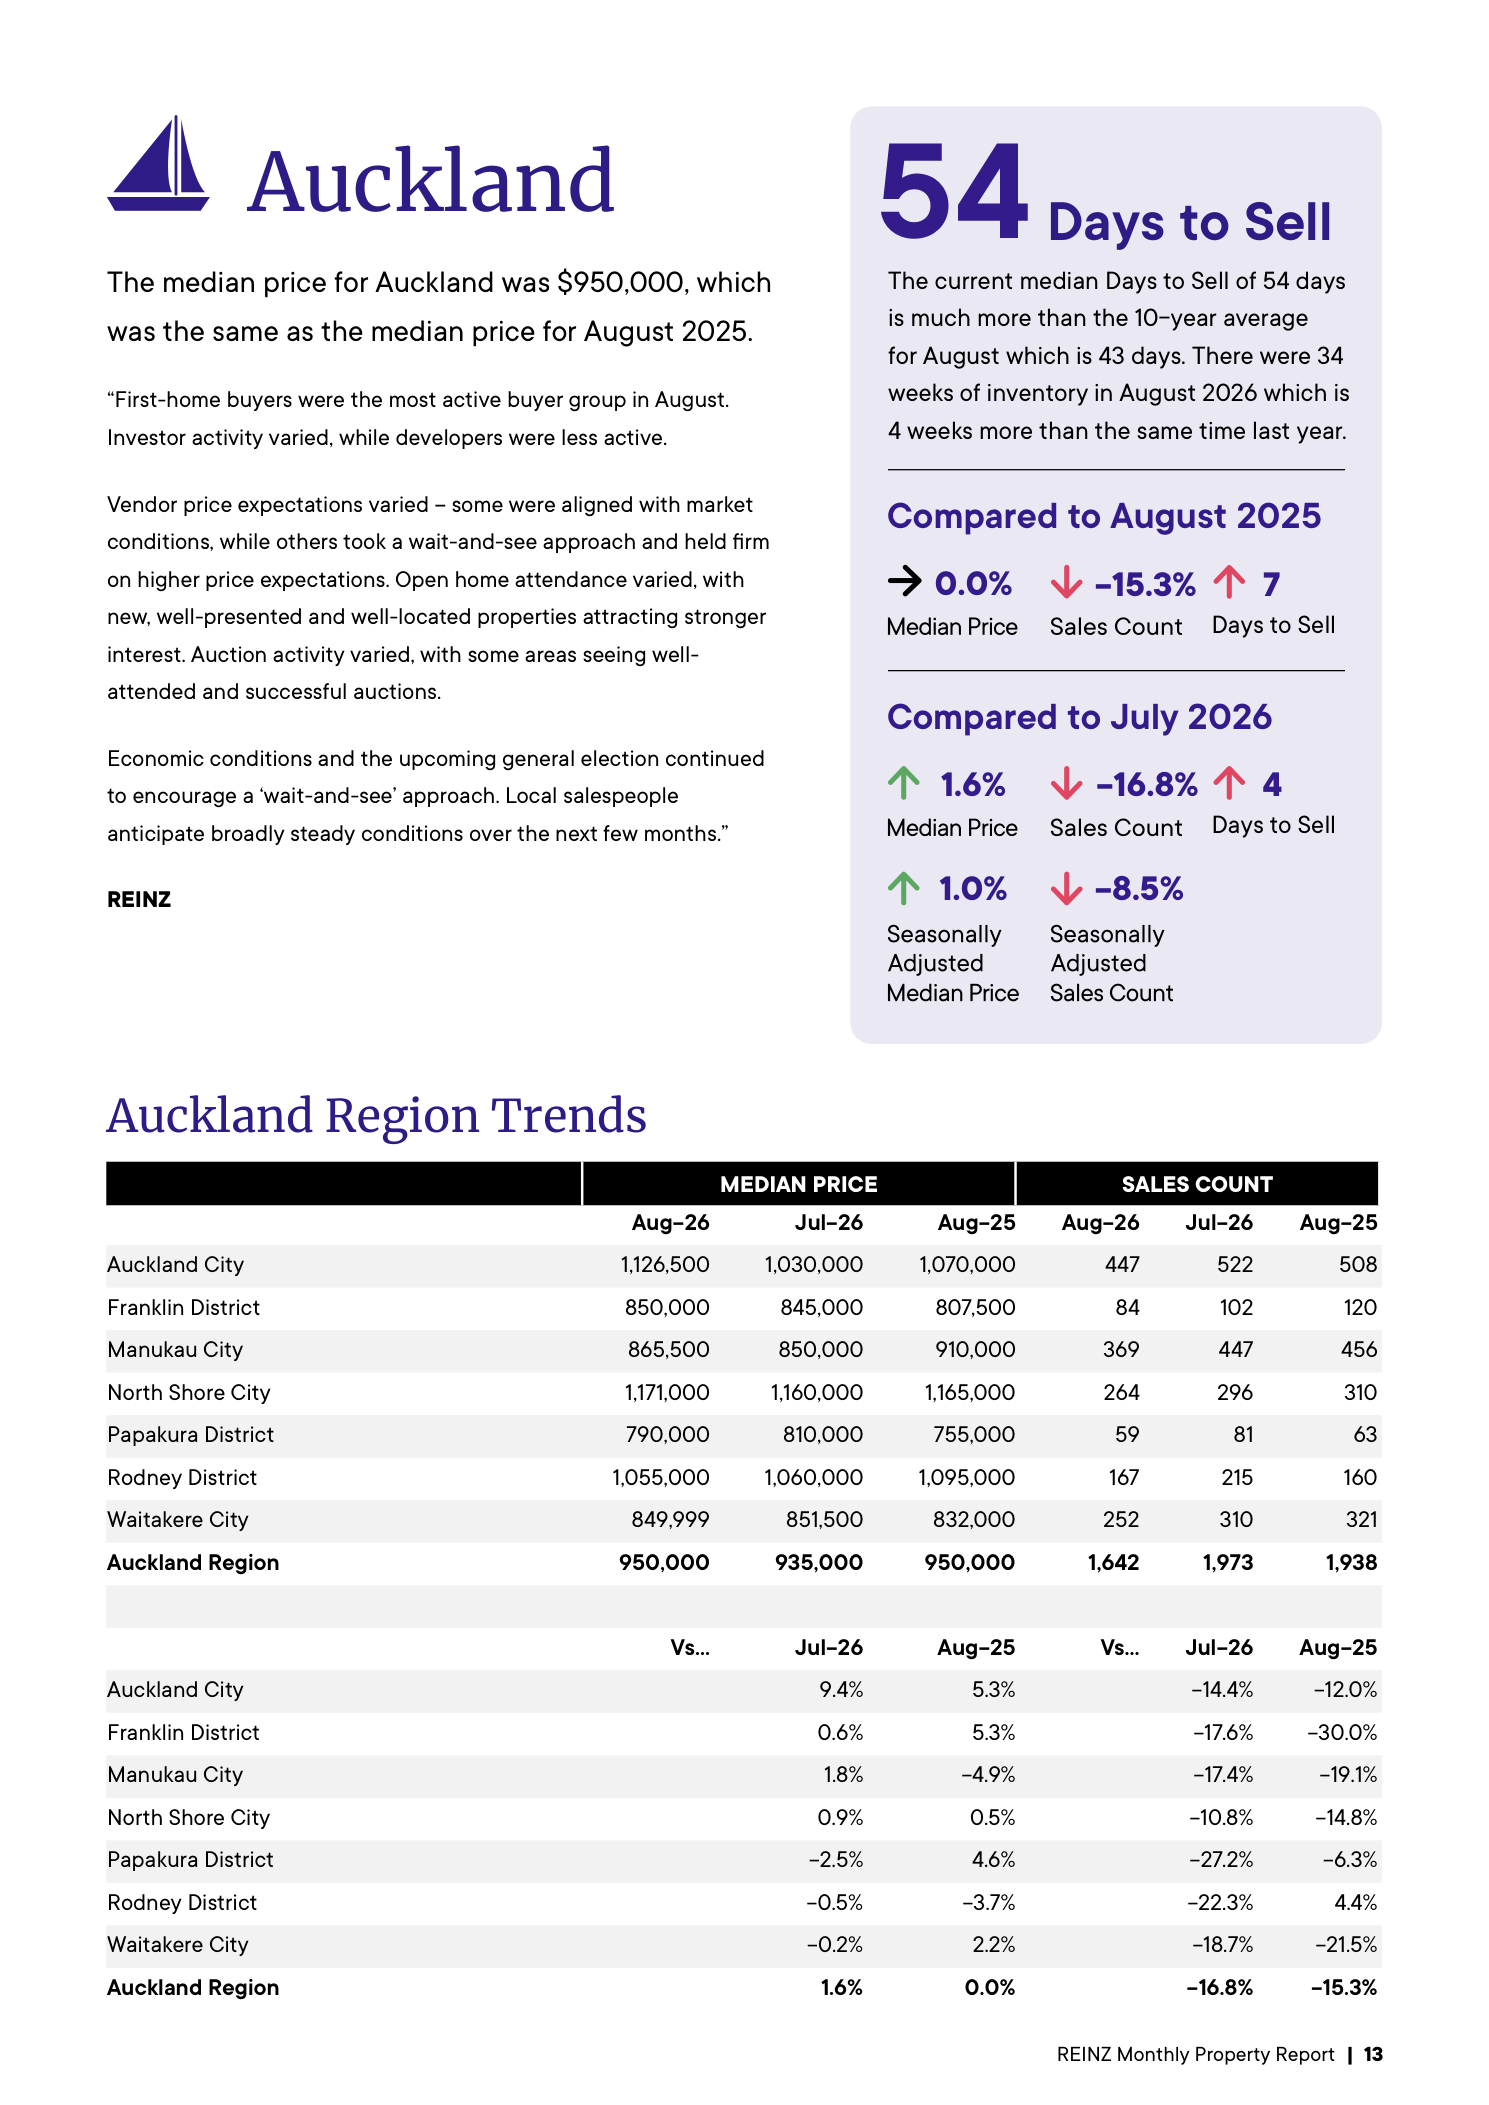
And Auckland and Wellington have now both recorded their slowest August selling times on record.
At Property Noise, we have a fairly simple question:
At what point do we stop calling this “steady”?
Because if this is what steady looks like, you’d hate to see what the industry considers weak.
Let’s forget the adjectives and look at the numbers
Here is REINZ’s August 2026 national snapshot:
| Measure | August 2026 | Annual change/context |
|---|---|---|
| National median price | $750,000 | -1.3% |
| Residential sales | 5,430 | -13.0% |
| REINZ HPI | 3,543 | -0.9% |
| Properties available | 32,908 | +9.7% |
| New listings | 8,326 | -5.1% |
| Median days to sell | 51 days | +3 days |
| Auction sales | 636 | 776 last August |
| Auction share | 11.7% | 12.4% last August |
These aren’t Property Noise numbers.
They’re REINZ’s.
And the sales number deserves particular attention.
Just 5,430 homes sold
Residential sales fell 13% from August 2025.
That’s not a trivial monthly fluctuation.
REINZ confirms that 5,430 sales made August 2026 the sixth-lowest August in 35 years of its records.
Interest.co.nz went further in its description today:
“a substantial decline in residential property sales”
It reports sales declines across all the major urban regions:
Auckland: -15%
Waikato: -19%
Bay of Plenty: -1%
Wellington: -14%
Canterbury: -10%
Otago: -24%
Gisborne: -35%
That isn’t a booming market.
It isn’t a recovering market.
It isn’t even a particularly busy market.
It’s a market struggling to transact.
And it’s taking longer to sell what does transact
The national median has stretched to 51 days.
That’s three days longer than August last year and, according to REINZ, the fourth-highest August days-to-sell figure on record.
It gets worse when you dig into the regions.
REINZ says:
Auckland: highest August days-to-sell figure on record.
Wellington: highest August days-to-sell figure on record.
New Zealand overall: highest August figure since 2008.
NZ excluding Auckland: highest August figure since 2008.
Canterbury: highest August figure since 2008.
Marlborough: highest August figure since 2014.
Taranaki: highest August figure since 2012.
And Manawatū-Whanganui took 56 days, matching its highest figure since February 2025.
There is one notable exception: Southland recorded its fastest August selling time since 2018.
Which reinforces an important point.
There are parts of New Zealand doing reasonably well.
But they don’t magically turn the national market into a strong one.
Wellington just set another unwanted record
Perhaps the most extraordinary regional statistic is Wellington.
It recorded its lowest number of August sales since REINZ’s records began.
Not the lowest since COVID.
Not the lowest since the Global Financial Crisis.
The lowest August on record.
Otago recorded its lowest August sales total since 2014.
Gisborne, Hawke’s Bay and Taranaki had their weakest August since 2021.
Again:
How exactly does an industry look at those numbers and lead with “steady”?
Here’s the statistic that should really worry vendors
There were 32,908 properties available for sale at the end of August.
That’s 9.7% more than a year ago.
Yet only 8,326 new listings came onto the market during August — 5.1% fewer than a year earlier.
Think about what those two numbers together are telling us.
New stock isn’t flooding onto the market.
Yet total stock keeps building.
Why?
Because properties aren’t clearing quickly enough.
REINZ itself acknowledges that elevated inventory reflects homes taking longer to sell.
Realestate.co.nz provides an even more brutal historical comparison.
Its August figures show 45% more homes available than three years ago — roughly 10,000 additional properties competing for purchasers.
Interest.co.nz says stock is at a 12-year high for this time of year and has more than doubled since the 2021 boom.
That is a buyer’s market.
Call it what it is.
Auckland and Wellington: 31 months and counting
Here’s another extraordinary statistic buried in the REINZ fact sheet:
Auckland and Wellington have now experienced 31 consecutive months of year-on-year inventory growth.
Thirty-one.
Consecutive.
Months.
That’s more than two and a half years of available stock growing compared with the corresponding month a year earlier.
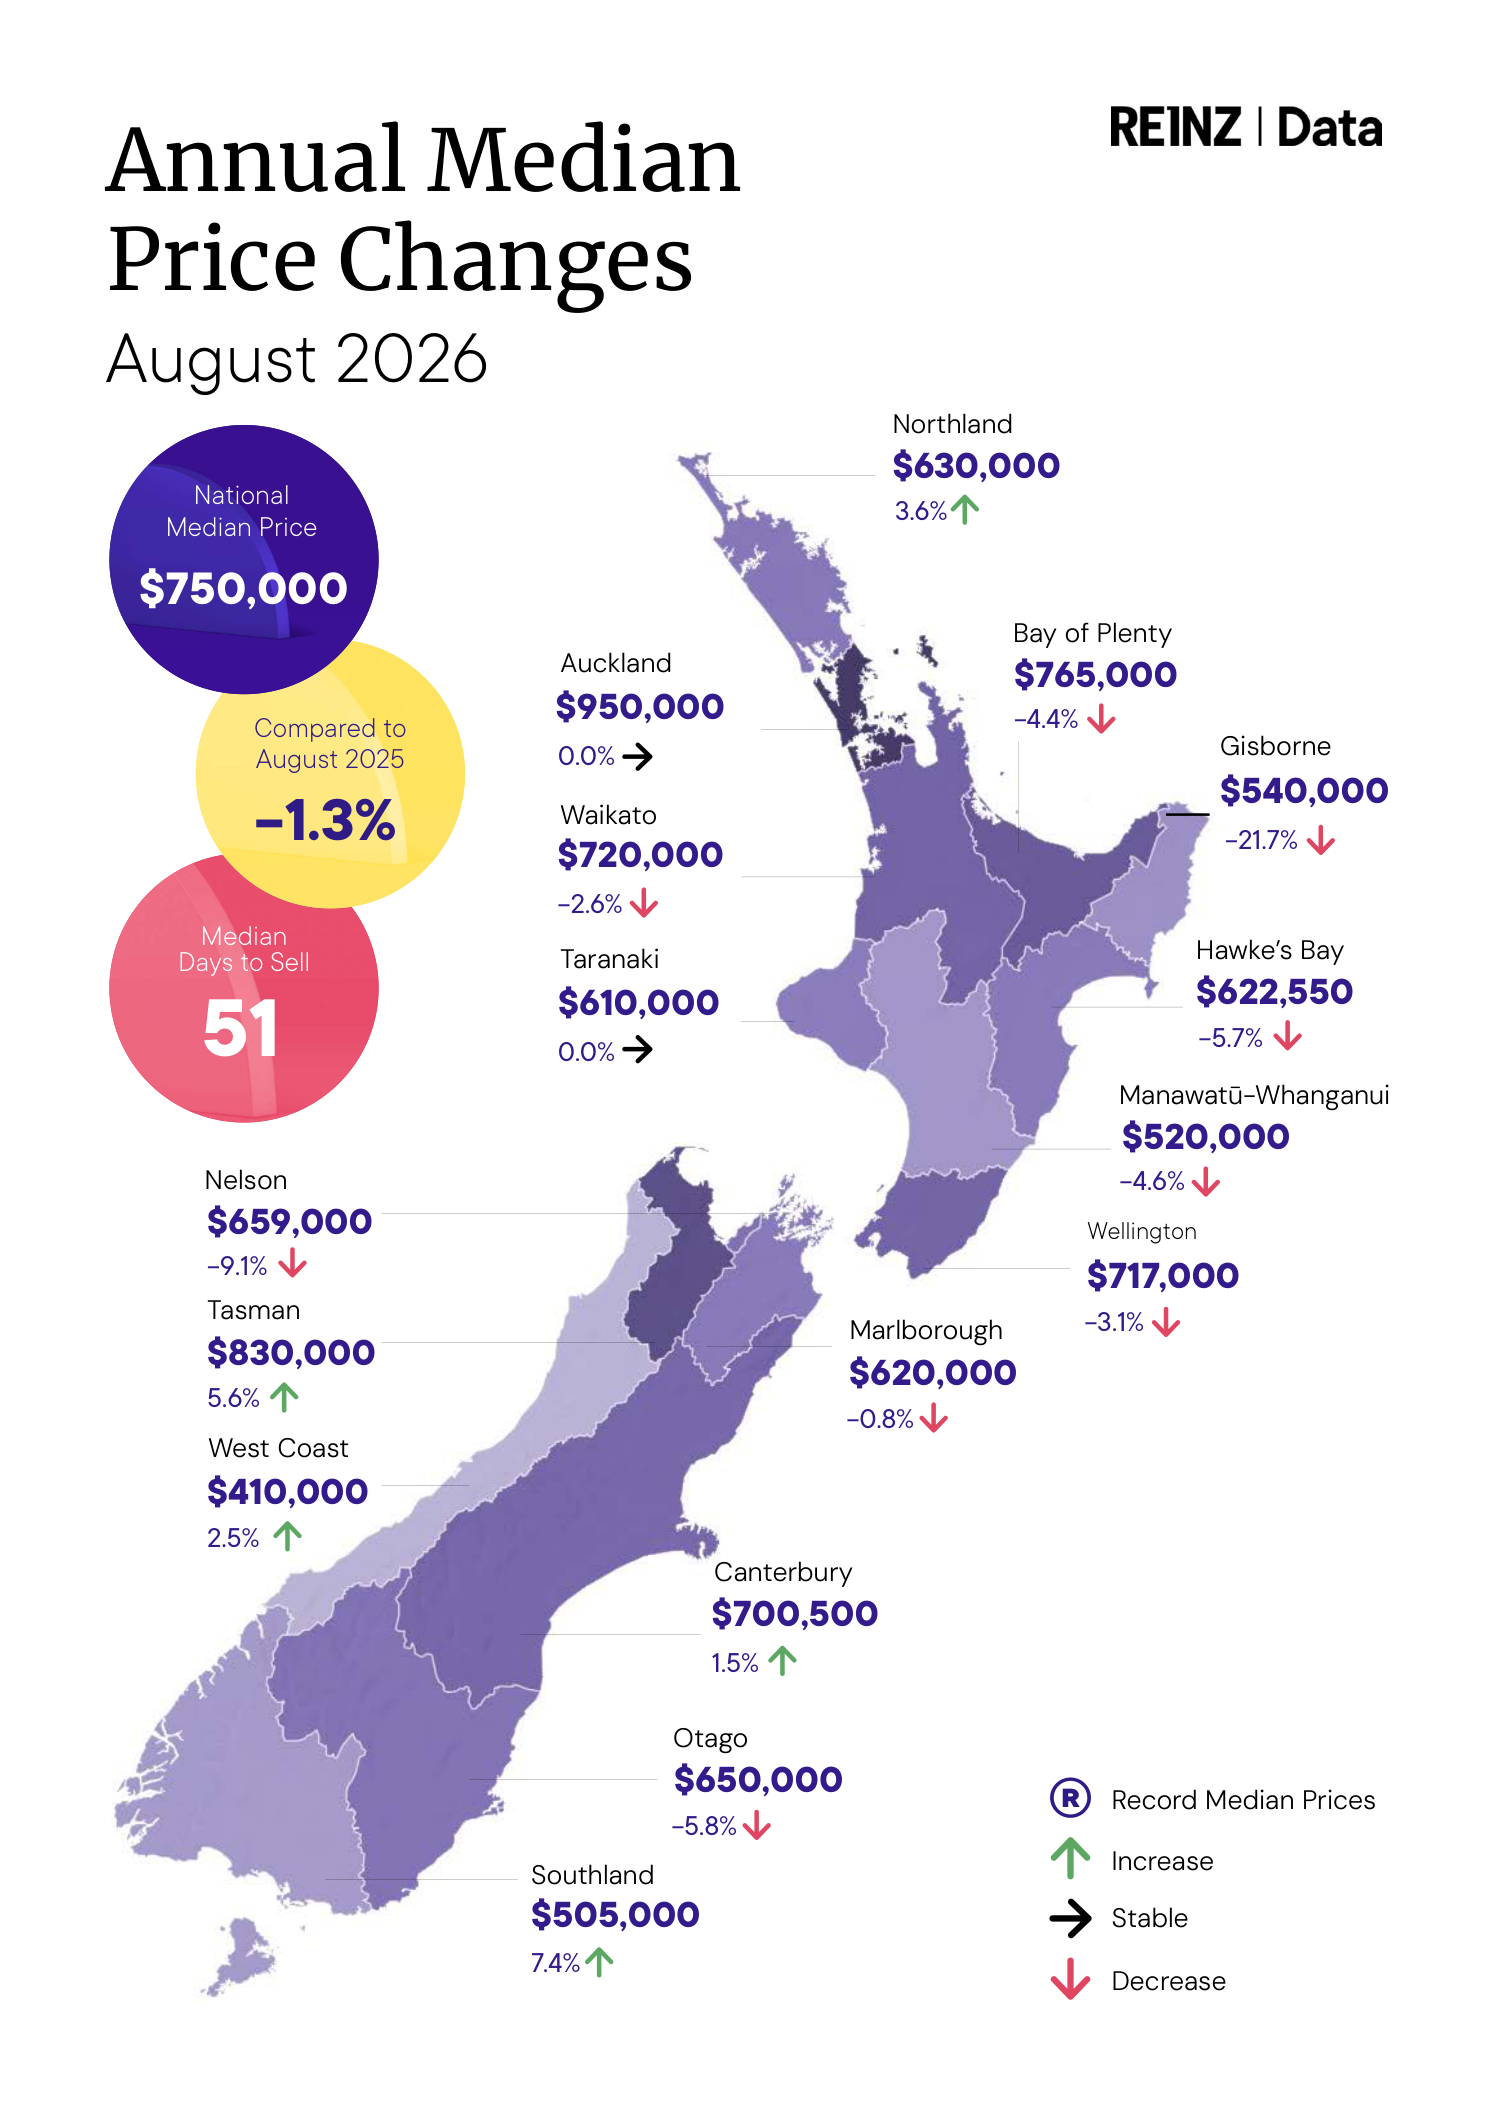
Meanwhile, the national median sale price has fallen to $750,000, down 1.3% year-on-year and 1.4% from July.
Again, prices aren’t collapsing.
That’s important.
But neither is this some convincing recovery.
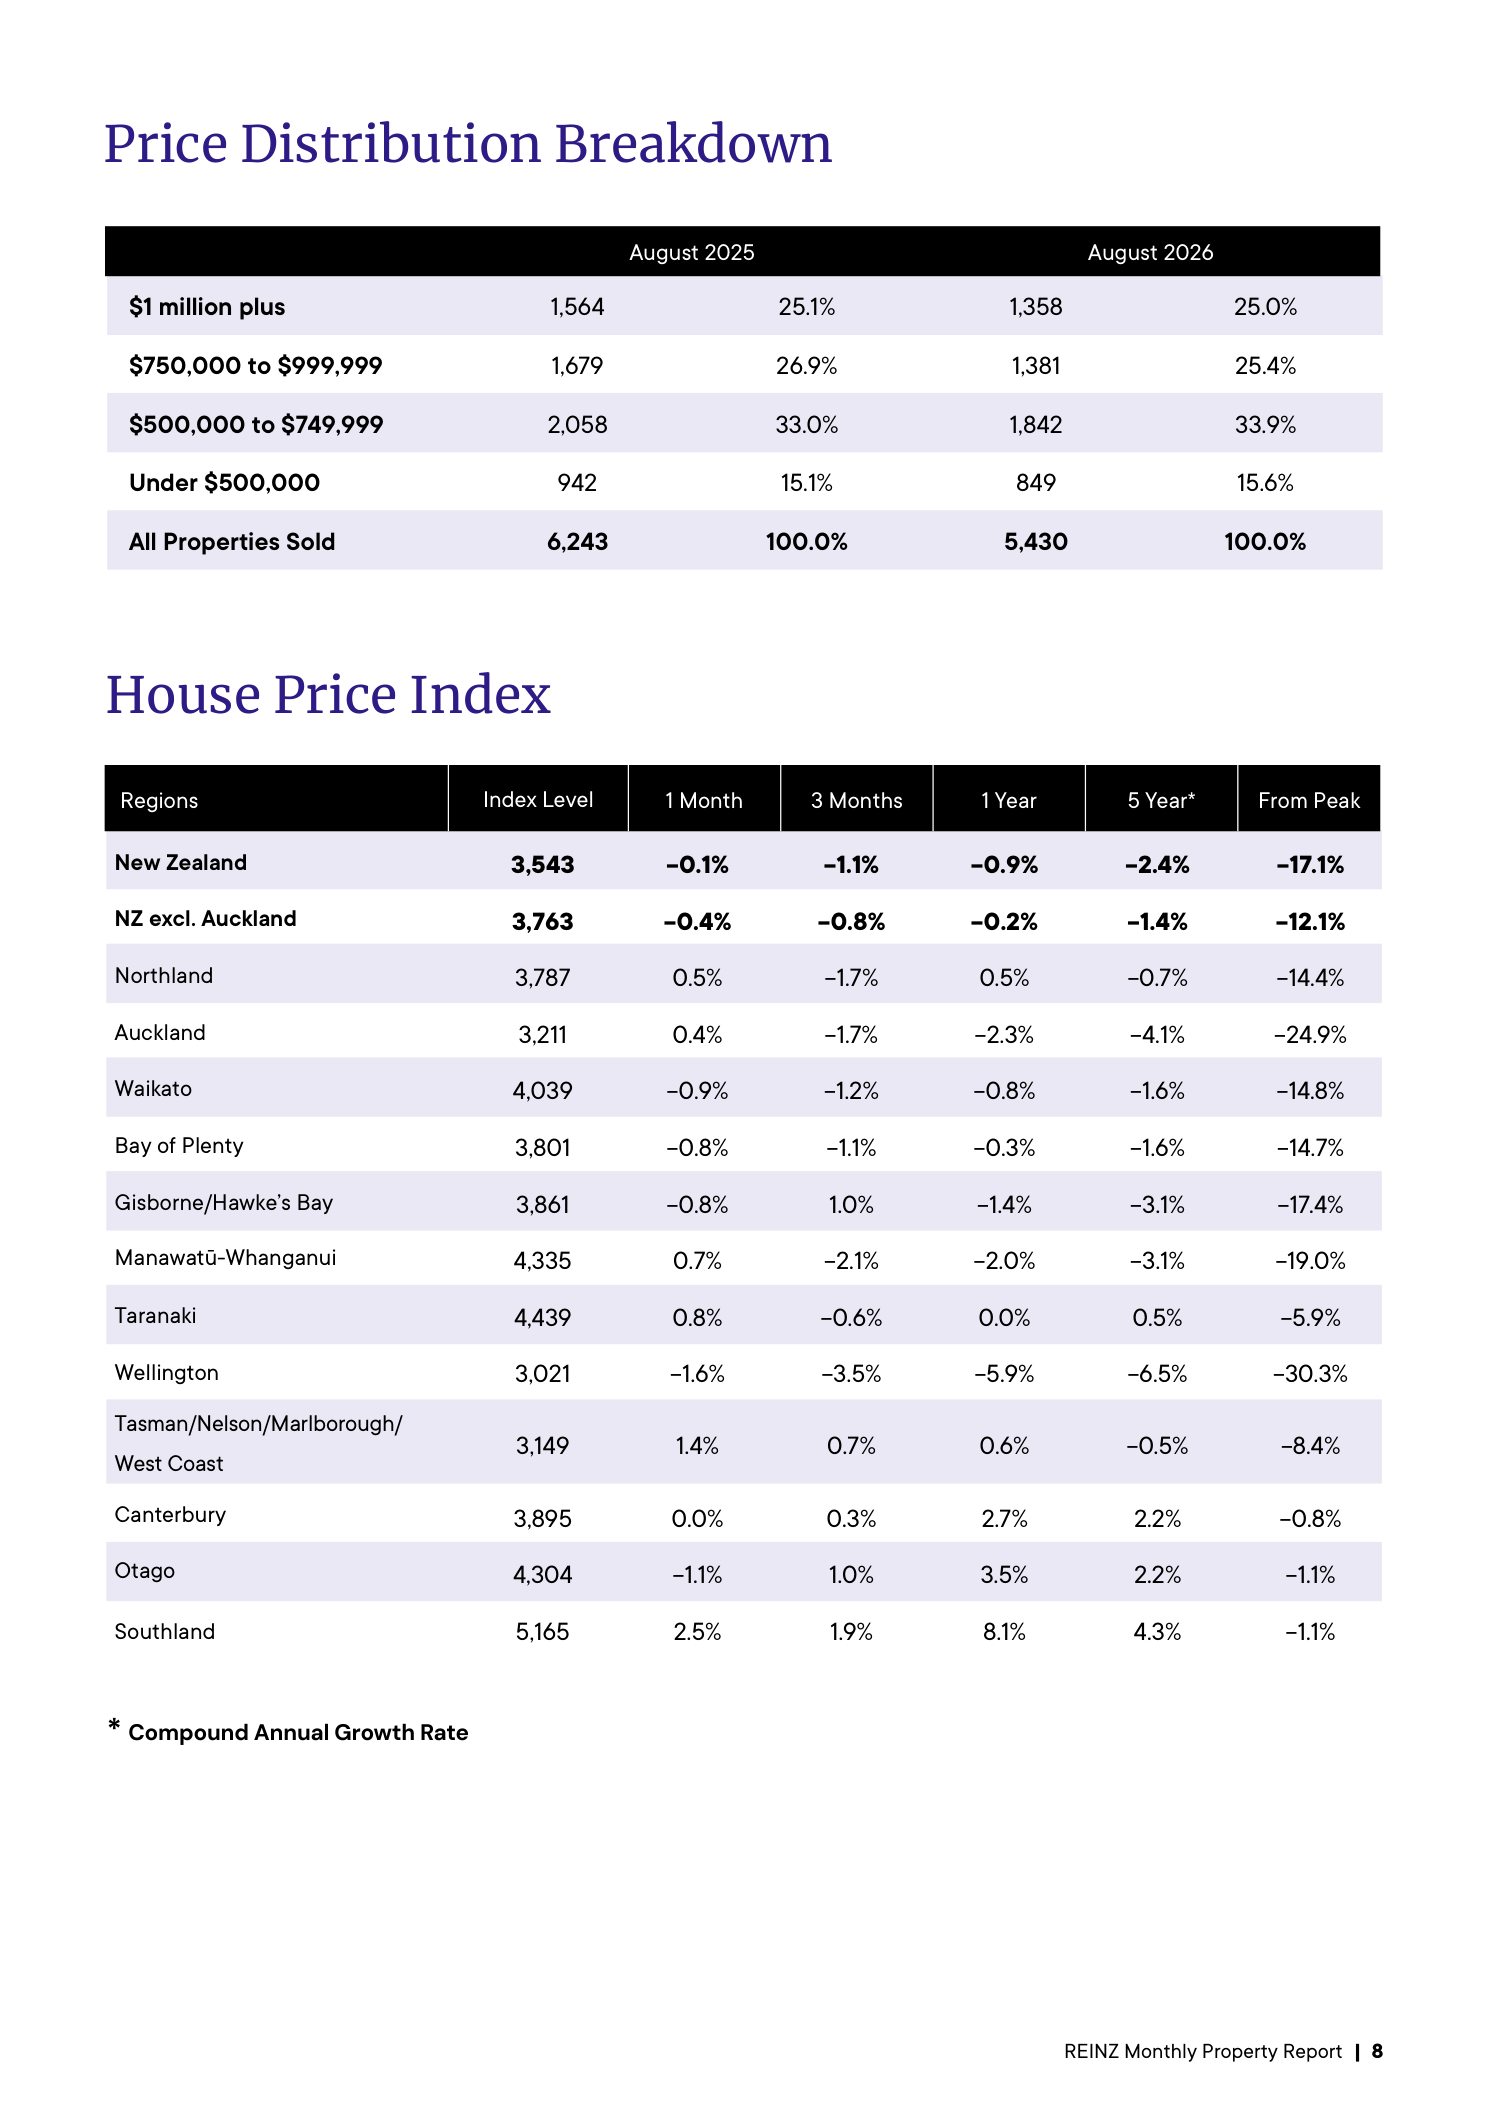
The HPI tells an even more interesting story
REINZ points to its HPI declining only 0.9% annually as evidence of price steadiness.
Fair enough.
But underneath that national number is an extraordinary geographic split.
Every South Island HPI series increased over the three months to August.
At the same time, seven of the eight North Island series declined.
Annual HPI movements included:
Southland: +8.1%
Otago: +3.5%
Canterbury: +2.7%
Meanwhile Auckland’s HPI was down 2.3% year-on-year.
So there isn’t really one “New Zealand property market” anymore.
There’s a patchwork of very different markets.
And some of the country’s biggest markets are among the weakest.
Yes — some regions are genuinely doing well
Property Noise isn’t going to commit the same sin in reverse and ignore positive numbers.
Five of the 16 regions recorded annual median-price increases.
Southland: $505,000, +7.4%, from 129 sales.
Tasman: $830,000, +5.6%, from 70 sales.
Northland: $630,000, +3.6%.
West Coast: $410,000, +2.5%.
Canterbury: $700,500, +1.5%.
Tasman sales actually increased 12.9% year-on-year.
Central Otago also achieved a record median of $895,000.
Those are strong results.
Say so.
But here’s the other side:
Sales fell in 13 of New Zealand’s 16 regions.
That’s also part of the story.
Auctions aren’t exactly screaming confidence either
There were 636 auction sales nationally during August.
A year earlier there were 776.
That’s a reduction of 140 auctions, or about 18%.
Auctions represented 11.7% of sales, compared with 12.4% last August.
Again, not catastrophic.
Just another indicator of a market lacking the urgency associated with a genuine upswing.
REINZ isn’t wrong about prices. That’s not really the issue.
This distinction matters.
REINZ says:
“Property values generally held steady nationally, even as transactions softened in August.”
On the narrow issue of national price movement, that’s reasonable.
The HPI fell only 0.9% annually.
The median fell 1.3%.
Those aren’t crash numbers.
But consumers don’t experience a housing market through one national median-price statistic.
A homeowner trying unsuccessfully to sell for seven or eight weeks experiences the market.
An agent chasing fewer transactions experiences it.
A vendor reducing expectations experiences it.
A buyer choosing among dozens of listings experiences it.
And an Auckland homeowner watching inventory rise for the 31st consecutive month experiences it.
That’s why the language matters.
“Slower activity” is doing some very heavy lifting
REINZ’s headline calls August:
“National prices steady amid slower activity and regional variation.”
Let’s translate “slower activity” using REINZ’s own statistics:
13% fewer sales.
Sixth-lowest August sales total in 35 years.
13 of 16 regions with declining sales.
Lowest Wellington August sales ever.
Fourth-highest national August days-to-sell ever.
Record August selling times in Auckland and Wellington.
Inventory up 9.7%.
31 straight months of rising annual inventory in Auckland and Wellington.
That’s considerably more informative than “slower activity”.
And then there’s the industry optimism
REINZ says its members expect conditions to remain “broadly steady”, with improving enquiries in some places creating “cautious optimism.”
We’ve heard versions of that language for a long time.
Lower interest rates will help.
Spring will help.
More buyers are looking.
Enquiries are improving.
Confidence is returning.
The recovery is coming.
But eventually transactions have to appear.
In August, they didn’t.
There were 5,430 of them.
And that was the sixth-worst August result in 35 years.
The Property Noise view
Let’s be very clear.
New Zealand’s housing market is not crashing.
Anyone claiming these figures show a nationwide property crash would be overstating the evidence.
Prices nationally have been remarkably sticky.
Some South Island markets are performing strongly.
Southland’s numbers are excellent.
Tasman is doing well.
First-home buyers remain active.
There are still thousands of transactions every month.
But the opposite spin shouldn’t get a free pass either.
A weak market doesn’t have to be a crashing market.
That’s the distinction the property industry sometimes seems reluctant to make.
You can have relatively stable prices and a seriously subdued transaction market simultaneously.
And that is exactly what these August figures appear to show.
Sales are weak.
Stock is high.
Selling times are long.
Buyers have choices.
FOMO is largely absent.
And in Auckland and Wellington particularly, vendors are operating in markets dramatically different from the frenzy of several years ago.
So perhaps it’s time to stop waiting for the next boom before deciding what to call the present.
5,430 sales.
Down 13%.
Sixth-lowest August in 35 years.
32,908 homes for sale.
Stock up 9.7%.
51 days to sell.
Those aren’t opinions.
They’re the numbers.
And sometimes the numbers make considerably more noise than the spin.
Official data: REINZ August 2026 Property Report summary.