

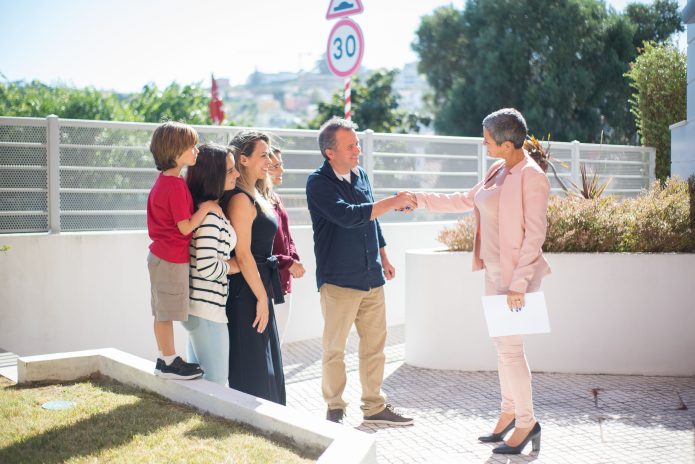


PHOTO: Australian homebuyers
A range of pandemic-fuelled factors has triggered a surge in the number of Australians interested in purchasing a home – but a change in buyer preference has pushed demand away from the inner cities to the suburbs and city outskirts, recent data has revealed.
Realestate.com.au has developed a new metric that tracks the number of “highly engaged” or serious buyers who are looking at properties at specific suburbs, creating an accurate picture of demand in the area.
The property market intelligence website described a highly engaged buyer as someone who is likely to make a home purchase based on their online activity, including “returning to a listing multiple times, looking at floorplans, emailing or calling the agent, and scheduling an appointment.”
Data gathered by the group in the 12 months ending in February showed a strong buyer preference for “lifestyle factors,” such as larger spaces and seaside living, which director of economic research Cameron Kusher said was a “COVID-effect.”
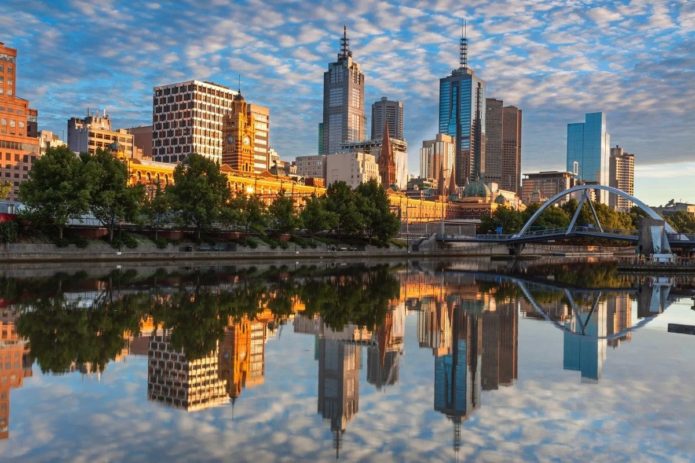
Victoria
| Houses | |||||
| Suburb | Highly engaged buyers | YoY growth | Buyer type | ||
| Subsequent buyers | First home buyers | Investors | |||
| Berwick | 41,481 | 53.0% | 46% | 41% | 13% |
| Mount Martha | 34,874 | 47.4% | 75% | 12% | 13% |
| Frankston | 34,355 | 44.7% | 38% | 43% | 18% |
| Mount Eliza | 32,084 | 53.6% | 84% | 7% | 9% |
| Mornington | 31,843 | 57.5% | 62% | 24% | 14% |
Source: Realestate.com.au
| Units | |||||
| Suburb | Highly engaged buyers | YoY growth | Buyer type | ||
| Subsequent buyers | First home buyers | Investors | |||
| Melbourne | 51,787 | 14.1% | 40% | 34% | 26% |
| South Yarra | 38,288 | 30.2% | 38% | 47% | 16% |
| St Kilda | 35,596 | 32.0% | 33% | 52% | 15% |
| Richmond | 31,423 | 17.8% | 32% | 53% | 15% |
| Hawthorn | 27,503 | 18.6% | 32% | 50% | 18% |
Source: Realestate.com.au
New South Wales
| Houses | |||||
| Suburb | Highly engaged buyers | YoY growth | Buyer type | ||
| Subsequent buyers | First home buyers | Investors | |||
| Kellyville | 37,371 | 39.7% | 63% | 29% | 8% |
| Castle Hill | 30,017 | 34.3% | 70% | 18% | 12% |
| Baulkham Hills | 25,789 | 22.8% | 59% | 29% | 13% |
| Blacktown | 24,410 | 48.4% | 34% | 45% | 21% |
| Port Macquarie | 21,447 | 43.7% | 59% | 19% | 22% |
Source: Realestate.com.au
| Units | |||||
| Suburb | Highly engaged buyers | YoY growth | Buyer type | ||
| Subsequent buyers | First home buyers | Investors | |||
| Mosman | 17,754 | 44.7% | 54% | 26% | 20% |
| Randwick | 16,541 | 39.4% | 43% | 41% | 16% |
| Wollongong | 15,969 | 53.8% | 35% | 38% | 27% |
| Sydney | 15,767 | 31.2% | 55% | 17% | 28% |
| Dee Why | 15,673 | 23.1% | 42% | 41% | 17% |
Source: Realestate.com.au
Queensland
| Houses | |||||
| Suburb | Highly engaged buyers | YoY growth | Buyer type | ||
| Subsequent buyers | First home buyers | Investors | |||
| Buderim | 42,239 | 50.8% | 74% | 14% | 12% |
| Camp Hill | 29,439 | 50.4% | 65% | 22% | 13% |
| Helensvale | 29,420 | 51.2% | 68% | 22% | 10% |
| Coorparoo | 28,766 | 49.9% | 67% | 21% | 12% |
| Southport | 26,838 | 49.8% | 56% | 22% | 22% |
Source: Realestate.com.au
| Units | |||||
| Suburb | Highly engaged buyers | YoY growth | Buyer type | ||
| Subsequent buyers | First home buyers | Investors | |||
| Surfers Paradise | 40,938 | 60.6% | 48% | 13% | 39% |
| Southport | 21,333 | 39.1% | 48% | 25% | 27% |
| Broadbeach | 19,332 | 55.9% | 54% | 11% | 35% |
| Maroochydore | 19,209 | 66.0% | 50% | 18% | 32% |
| Palm Beach | 19,047 | 44.4% | 50% | 23% | 28% |
Source: Realestate.com.au
Western Australia
| Houses | |||||
| Suburb | Highly engaged buyers | YoY growth | Buyer type | ||
| Subsequent buyers | First home buyers | Investors | |||
| Scarborough | 15,797 | 49.7% | 55% | 34% | 10% |
| Dianella | 14,926 | 32.3% | 56% | 36% | 8% |
| Baldivis | 14,647 | 60.2% | 54% | 38% | 8% |
| Duncraig | 14,229 | 36.7% | 64% | 30% | 6% |
| Canning Vale | 13,743 | 43.4% | 48% | 45% | 7% |
Source: Realestate.com.au
| Units | |||||
| Suburb | Highly engaged buyers | YoY growth | Buyer type | ||
| Subsequent buyers | First home buyers | Investors | |||
| Scarborough | 13,268 | 40.7% | 42% | 41% | 17% |
| Perth | 11,790 | 46.1% | 43% | 34% | 23% |
| East Perth | 10,050 | 35.9% | 42% | 35% | 23% |
| South Perth | 9,763 | 33.6% | 56% | 24% | 30% |
| West Perth | 9,325 | 60% | 44% | 34% | 22% |
Source: Realestate.com.au
South Australia
| Houses | |||||
| Suburb | Highly engaged buyers | YoY growth | Buyer type | ||
| Subsequent buyers | First home buyers | Investors | |||
| Prospect | 19,226 | 39.4% | 59% | 25% | 16% |
| Hallet Cove | 16,703 | 38.4% | 53% | 37% | 10% |
| Norwood | 16,517 | 53.7% | 71% | 13% | 15% |
| Morphett Vale | 16,429 | 47.6% | 38% | 48% | 14% |
| Magill | 16,000 | 13.9% | 55% | 33% | 12% |
Source: Realestate.com.au
| Units | |||||
| Suburb | Highly engaged buyers | YoY growth | Buyer type | ||
| Subsequent buyers | First home buyers | Investors | |||
| Adelaide | 20,427 | 26.2% | 42% | 22% | 36% |
| Glenelg | 7,698 | 24.5% | 54% | 9% | 37% |
| Norwood | 7,637 | 13.4% | 45% | 28% | 26% |
| Glenelg North | 6,172 | 14.9% | 44% | 17% | 39% |
| North Adelaide | 5,674 | 1.8% | 49% | 21% | 30% |
Source: Realestate.com.au
Tasmania
| Houses | |||||
| Suburb | Highly engaged buyers | YoY growth | Buyer type | ||
| Subsequent buyers | First home buyers | Investors | |||
| Sandy Bay | 13,526 | 20.6% | 68% | 10% | 22% |
| Kingston | 11,796 | 23.6% | 50% | 35% | 15% |
| Howrah | 10,758 | 10.9% | 52% | 36% | 12% |
| Lindisfarne | 10,686 | 27.9% | 55% | 30% | 15% |
| Devonport | 10,269 | 21.1% | 47% | 31% | 22% |
Source: Realestate.com.au
| Units | |||||
| Suburb | Highly engaged buyers | YoY growth | Buyer type | ||
| Subsequent buyers | First home buyers | Investors | |||
| Sandy Bay | 5,242 | -3.4% | 46% | 21% | 33% |
| Kingston | 4,027 | 42.4% | 39% | 44% | 17% |
| Bellerive | 3,621 | 63.1% | 43% | 34% | 23% |
| Hobart | 3,592 | 18.2% | 43% | 17% | 41% |
| Claremont | 3,501 | 83.8% | 36% | 43% | 21% |
Source: Realestate.com.au
Northern Territory
| Houses | |||||
| Suburb | Highly engaged buyers | YoY growth | Buyer type | ||
| Subsequent buyers | First home buyers | Investors | |||
| Leanyer | 4,231 | 46.6% | 40% | 55% | 5% |
| Humpty Doo | 3,797 | 89.9% | 59% | 37% | 4% |
| Durack | 3,652 | 53.3% | 44% | 51% | 6% |
| Howard Springs | 3,239 | 49.1% | 64% | 29% | 7% |
| Muirhead | 3,024 | 99.9% | 34% | 55% | 11% |
Source: Realestate.com.au
| Units | |||||
| Suburb | Highly engaged buyers | YoY growth | Buyer type | ||
| Subsequent buyers | First home buyers | Investors | |||
| Darwin City | 5,115 | 67.5% | 41% | 34% | 25% |
| Stuart Park | 3,114 | 60.4% | 41% | 47% | 12% |
| Larrakeyah | 2,826 | 43.3% | 56% | 24% | 30% |
| Nightcliff | 2,398 | 80.6% | 39% | 49% | 12% |
| Fannie Bay | 1,965 | 97.3% | 41% | 45% | 14% |
Source: Realestate.com.au
Australian Capital Territory
| Houses | |||||
| Suburb | Highly engaged buyers | YoY growth | Buyer type | ||
| Subsequent buyers | First home buyers | Investors | |||
| Kambah | 6,433 | 122.1% | 46% | 41% | 10% |
| Ngunnawal | 5,415 | 104.5% | 37% | 55% | 8% |
| Wanniassa | 4,142 | 99.7% | 44% | 46% | 10% |
| Bonner | 3,802 | 69.2% | 39% | 54% | 6% |
| Macgregor | 3,687 | 75.8% | 34% | 59% | 7% |
Source: Realestate.com.au
| Units | |||||
| Suburb | Highly engaged buyers | YoY growth | Buyer type | ||
| Subsequent buyers | First home buyers | Investors | |||
| Kingston | 4,261 | 92.1% | 46% | 24% | 20% |
| Braddon | 4,154 | 76.2% | 39% | 42% | 19% |
| Bruce | 4,042 | 89.7% | 35% | 48% | 17% |
| Belconnen | 3,845 | 87.9% | 33% | 45% | 22% |
| Griffith | 3,472 | 121.3% | 42% | 35% | 23% |
Source: Realestate.com.au
READ MORE VIA YOUR MORTGAGE