


PHOTO: CoreLogic New Zealand
Summary:
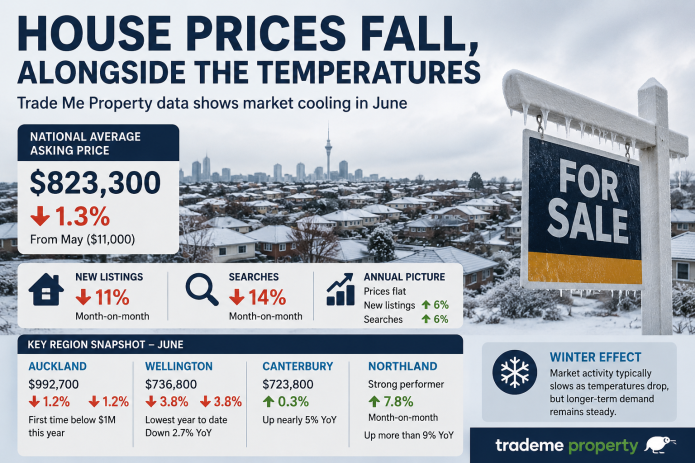
– Latest CoreLogic House Price Index (HPI) is likely to add fuel to the property market fire. Nationwide, property value growth accelerated further over November, increasing 2.1%, after already lifting in both September and October. You have to go all the way back to October 2004 (2.2%) to find a time of stronger monthly growth.
– The nationwide growth is also reflected throughout the country with each of the three sub-indices (Main Urban, Provincial and Rural) seeing accelerated rates of value growth through the last month.
– Mortgage serviceability is improving as mortgage payments come down off the back of lower interest rates. However the metrics used to assess the ability to get into the market are all illustrating a worsening situation. The ratio of housing values compared to household income has jumped from 6.2 a year ago, to 6.8 at the end of Q3. Meanwhile the average time it takes to save for a 20% deposit in NZ is now 9.0 years, up from 8.2 years a year ago, and the share of income dedicated towards renting is increasing as well – up from 19.8% in Q3 2019 to 21.2% in the most recent reading.
– Supply, by way of properties listed for sale, will remained constrained for the rest of the year. Meanwhile demand for mortgages, as measured by valuations ordered through the banks, is remaining strong and this is unlikely to change throughout summer, aside from the usual holiday lull. So expect values to remain pressured, and the Government likewise.
READ THE FULL REPORT 201130 CoreLogic_NZ_NovHousePriceIndex1Dec20FINAL
Main Centres
| Change in property values | Average Value | |||
| Month | Quarter | Annual | ||
| Auckland | 2.1% | 4.0% | 7.5% | $1,038,477 |
| Hamilton | 1.6% | 2.6% | 10.5% | $596,912 |
| Tauranga | 2.1% | 2.9% | 7.9% | $760,560 |
| Wellington | 2.9% | 5.8% | 13.5% | $735,507 |
| Christchurch | 1.0% | 2.3% | 5.2% | $504,952 |
| Dunedin | 3.1% | 4.8% | 13.1% | $505,461 |
Provincial Centres
| Change in property values | Average Value | |||
| TA | Month | Quarter | Annual | |
| Invercargill | 2.2% | 2.0% | 9.8% | $370,216 |
| Nelson | 1.0% | 3.2% | 6.9% | $681,891 |
| Napier | 2.2% | 3.2% | 10.6% | $636,257 |
| Whangarei | 2.1% | 5.4% | 12.2% | $610,588 |
| Queenstown | 3.5% | 5.5% | -1.4% | $1,190,592 |
| New Plymouth | 2.0% | 5.7% | 11.1% | $543,807 |
| Hastings | 4.3% | 5.7% | 13.0% | $627,649 |
| Kapiti Coast | 2.9% | 6.0% | 13.3% | $712,509 |
| Whanganui | 3.8% | 6.2% | 18.6% | $392,430 |
| Rotorua | 4.3% | 6.3% | 15.8% | $571,133 |
| Palmerston North | 3.9% | 7.9% | 18.1% | $562,723 |
| Gisborne | 4.6% | 14.6% | 26.3% | $496,990 |