


PHOTO: For decades, New Zealanders have been told one simple rule of thumb: property doubles every 10 years. PROPERTY NOISE
🧠 The Big Question Facing Kiwi Investors
Is your KiwiSaver quietly outperforming your house?
For decades, New Zealanders have been told one simple rule of thumb: property doubles every 10 years. But fresh data suggests that belief may no longer stack up — and hasn’t for some time.
When you compare housing, KiwiSaver, and other asset classes over the past decade, the results may surprise even seasoned property investors.
📊 Property Price Growth: The Reality Check
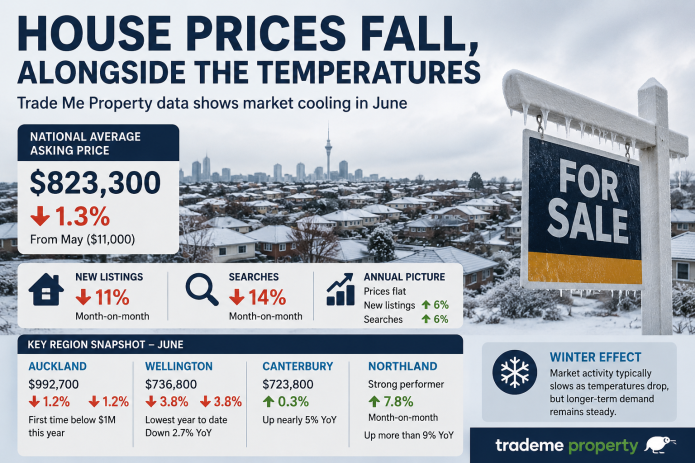
Between 2015 and 2025, national house price growth in New Zealand has been solid — but far from spectacular.
🇳🇿 National Snapshot
Average asking price (2015): $556,931
Average asking price (2025): $863,747
Total growth: +55.1% over 10 years
That’s respectable — but it’s not a doubling.

SOURCE: realestate.co.nz
🏙 Auckland Performance
2015: $846,730
2025: $1,045,328
Total growth: +23.5%
Once inflation, rates, insurance, maintenance, and compliance costs are factored in, real returns in some regions look surprisingly thin.
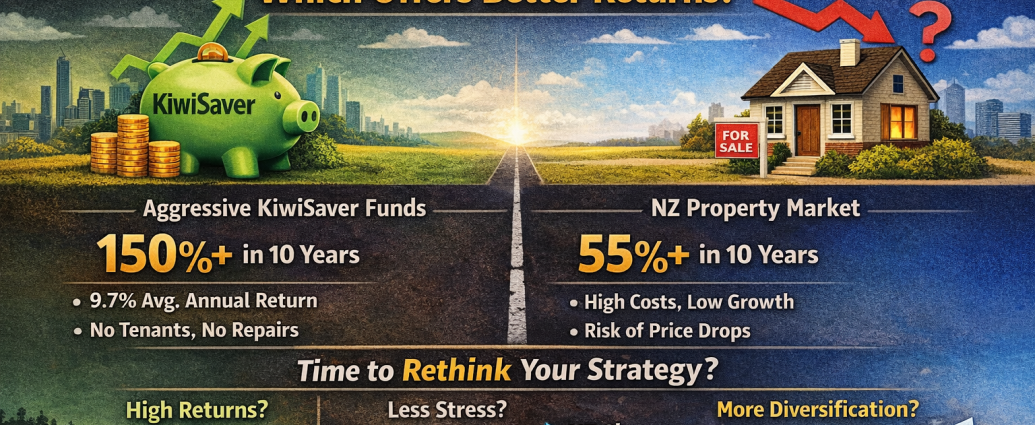
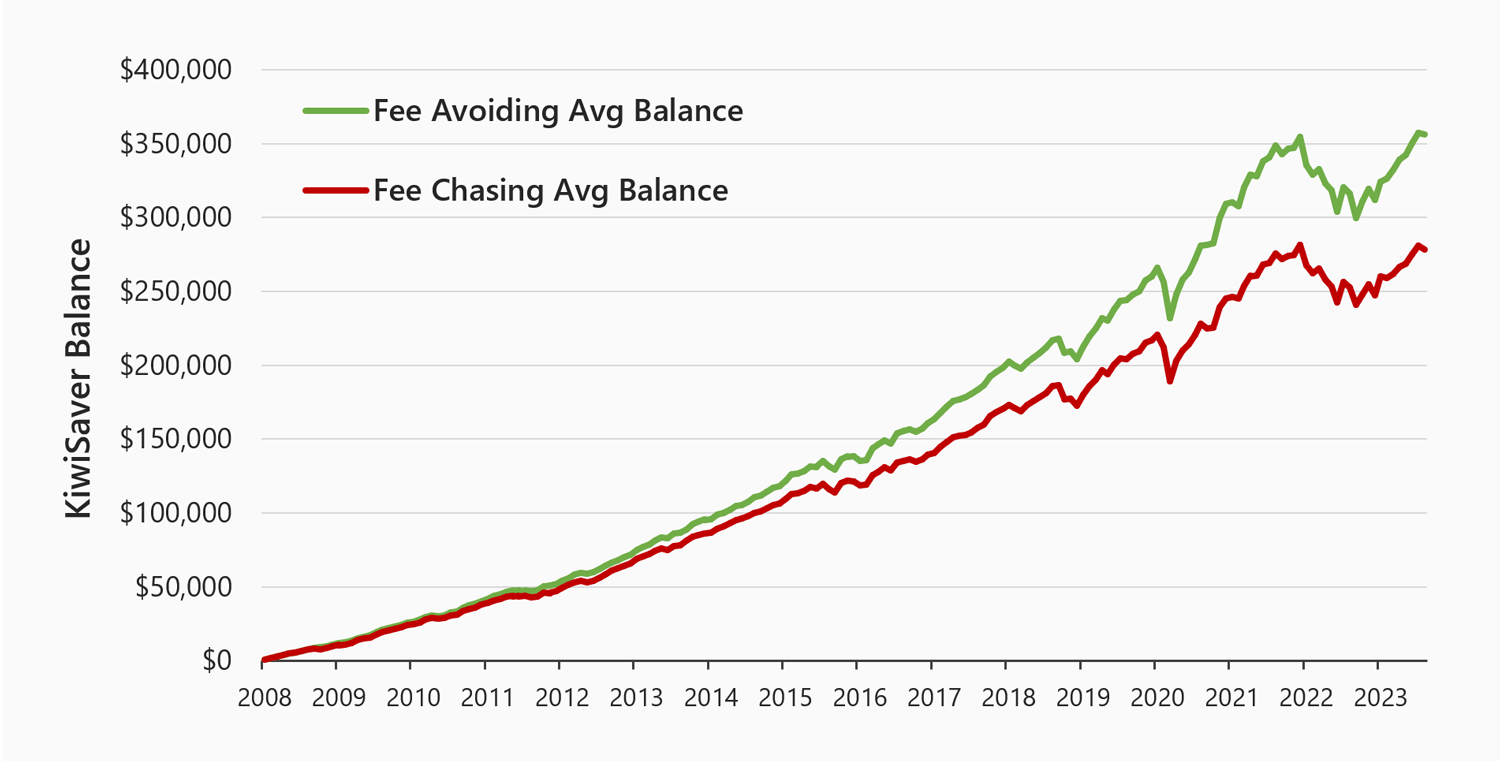
📈 How KiwiSaver Compares Over the Same Period
While property growth slowed, KiwiSaver quietly powered ahead.
According to long-term performance data:
Aggressive KiwiSaver funds delivered ~9.7% per year
Cumulative return: ≈150% over 10 years
👉 That’s nearly three times Auckland’s housing growth — without tenants, leaks, rates bills, or interest rate stress.
For many households, KiwiSaver is now their largest asset outside the family home — and in some cases, their best-performing one.
💰 Other Investments That Outpaced Housing
Housing hasn’t just lagged KiwiSaver — it’s been beaten by multiple asset classes:
| Asset Class | Approx. 10-Year Gain |
|---|---|
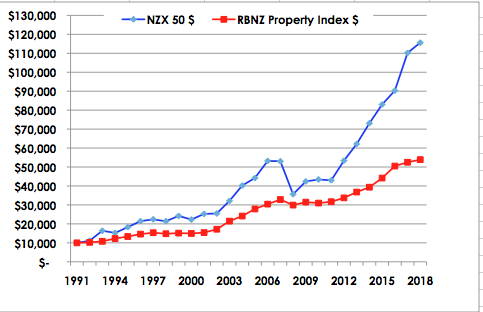
| NZ Shares (NZX50 – price only) | ~58% |
| Gold | 270%+ |
| Bitcoin | 50,000%+ |
| Aggressive KiwiSaver | ~150% |
| NZ Housing (national avg) | ~55% |
⚠️ While volatility differs, the long-term trend is clear: property is no longer the standout performer it once was.
🧮 Why Property Feels Better Than It Performs
So why do Kiwis still swear by property?
🔑 Leverage (The Double-Edged Sword)
Property allows investors to borrow heavily, amplifying gains — but also losses.
Recent years have reminded investors that:
Property can fall
Equity can evaporate
Cashflow can turn negative fast
Unlike shares or KiwiSaver, leverage cuts both ways.
🧠 The Myth of “Property Always Goes Up”
A critical mindset shift is underway.
For years, investors assumed:
Property only rises
Values never go backwards
Time alone guarantees profit
But history — and recent downturns — tell a different story.
📉 Property values do fall, and in some regions, they’ve stayed flat or declined for years.
🗺 Regional Winners Still Exist (But They’re Uneven)
To be fair, some regions did outperform:
Gisborne: +145.5%
Manawatū-Whanganui: +121.5%
Central North Island: +119.2%
However, these gains are not universal, and they depend heavily on:
Timing
Location
Housing type
Economic drivers
The “double every decade” rule has never applied everywhere.
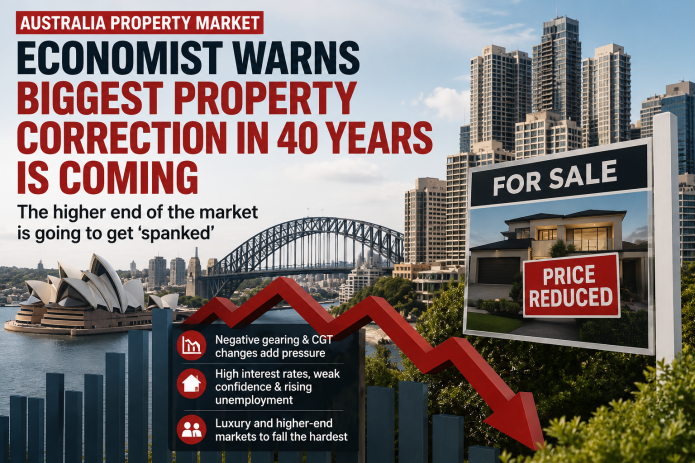
🧾 What Changes the Game Going Forward?
Several structural shifts could cap future house price growth:
🏛 Tax Reform Pressure
Capital gains tax remains firmly “on the radar”
Appetite is growing for less favourable treatment of property
🏗 Land & Supply Reform
More land availability
Higher density rules
Increased new-build supply
👵 Wealth Transfer Ahead
Baby boomers hold a disproportionate share of property wealth
Many will sell to fund retirement or distribute estates
Increased listings = reduced scarcity pressure
🔮 What Returns Might Look Like Next
Long-run historical housing growth has averaged:
6–7% per year (historically)
Future expectations are more conservative:
4–5% per year appears more realistic
Yes — house prices may still double.
But it will take longer, and the ride may be bumpier.
🧠 Final Take: KiwiSaver or Property?
It’s no longer an either/or conversation.
✔ Property still plays a role
✔ KiwiSaver has proven its strength
✔ Diversification matters more than ever
For many New Zealanders, KiwiSaver may now be the superior long-term investment — at least on a risk-adjusted basis.
The era of property as the automatic winner is over.
SOURCE: RNZ