


PHOTO: Sales Volumes Surprise as Confidence Builds Beneath the Surface. PROPERTY NOISE
New Zealand’s property market has closed out 2025 on firmer footing than many expected, with sales activity and median prices holding up through December — traditionally one of the quietest months of the year.
Fresh data from Real Estate Institute of New Zealand (REINZ) shows that while momentum eased heading into the summer holidays, underlying demand remained resilient, particularly outside Auckland and across several key regional markets.
🏠 National Sales Higher Than Last Year
Despite a seasonal slowdown in raw numbers, sales activity finished well ahead of December 2024.
National sales: up 8.1% year-on-year to 6,644
Excluding Auckland: sales up 10.6% to 4,758
Month-on-month (raw): down 12.2%
Seasonally adjusted: only a modest decline
REINZ Chief Executive Lizzy Ryley says December figures need careful interpretation.
“From November through February, it can be difficult to separate normal seasonal changes from genuine market shifts,” she said.
“After seasonal adjustment, it’s clear the market is holding up better than the raw numbers suggest.”

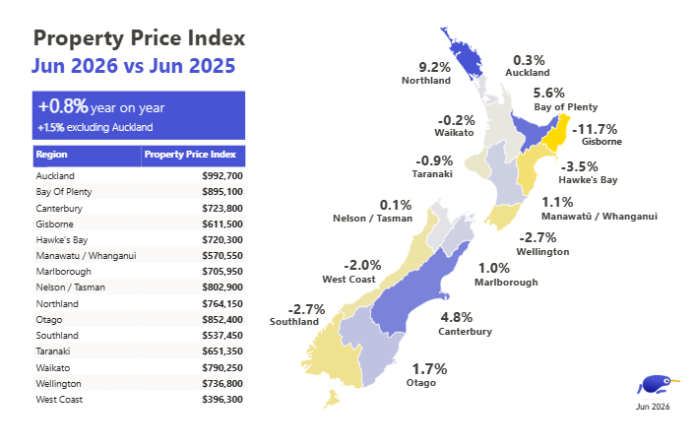
💰 Median Prices Hold Steady — And In Many Regions, Rise
Price stability was one of the standout features of December’s data.
National median price: $786,977 (↑ 1.4% YOY)
Excluding Auckland: $718,000 (↑ 2.1% YOY)
Auckland: $1,015,000 (↑ 1.5% YOY, third month above $1m)
Importantly, 12 of 16 regions recorded a year-on-year increase in median prices, highlighting how uneven — but broadly positive — the recovery has become.
📍 Regional Markets Quietly Take the Lead
Several regions outperformed expectations during what is normally a subdued trading period.
Regional standouts included:
Gisborne: median price up 24.8% YOY, setting a new regional record
Canterbury: median price matched its all-time high
Waikato & Manawatū-Whanganui: stronger-than-expected buyer activity
Two territorial authority records were also set:
Ōpōtiki District: new median record
Gisborne District: surpassed its previous peak
Ryley says this reflects localised confidence, rather than a single national trend.
“Attendance at open homes and enquiry levels were above last year in several regions, suggesting improved engagement despite the seasonal slowdown.”

⏱️ Homes Selling Faster — In Most Places
Another signal of strengthening conditions was the improvement in Days to Sell.
National median Days to Sell: 39 days (↓ 2 days YOY)
Excluding Auckland: 38 days (↓ 3 days YOY)
Notable movements:
Southland: fastest improvement, down 19 days
West Coast: longest selling times, rising to 84 days
This divergence reinforces the two-speed nature of the current market.
📦 Listings & Inventory: Buyers Still Have Choice
Supply levels remain elevated — a key reason buyers are behaving confidently rather than urgently.
New listings: up 2.8% YOY nationally
Inventory: up 3.1% YOY to 30,390 properties
Auckland and Wellington have now recorded nearly two years of consecutive inventory growth, giving buyers leverage — but also providing the liquidity needed for sales to occur.
🧑💼 Who’s Buying? First-Home Buyers Still Dominate
Lower interest rates and improved affordability continue to support market participation.
“First-home buyers and owner-occupiers remain the dominant force,” Ryley said.
“High stock levels allow buyers to take a more measured and confident approach.”
This dynamic is preventing price spikes — but not stalling transactions.
🔨 Auctions Regain Momentum
Auctions played a growing role through December:
National auction sales: 915
Share of total sales: 13.8%
Auckland: auctions accounted for 21.7% of sales
This points to renewed seller confidence, particularly in urban and higher-value markets.
📉 House Price Index: Still Below Peak — But Stabilising
The House Price Index (HPI) remains subdued but shows signs of bottoming.
NZ HPI: 3,603
YOY: −0.4%
Month-on-month: −0.6%
Below peak: −15.7%
Some regions, however, are already breaking new ground:
Otago: record-high HPI
Southland: strongest YOY growth for five consecutive months
Over five years, national HPI compound growth sits at 1.0% per annum, reinforcing the long-term reset now underway.
🔮 What This Means for 2026
The data points to a market that is:
✔ Stable, not booming
✔ Active, not frozen
✔ Regionally diverse
✔ Gradually rebuilding confidence
As 2026 begins, momentum is expected to improve steadily, rather than surge — with regions, not cities, likely to lead the next phase.
SOURCE: REINZ