


PHOTO: The Market Didn’t Bolt… But It’s Definitely Stretching Its Legs. PROPERTY NOISE
New Zealand’s property market has trotted cautiously into 2026 — not a full-blown gallop, but far from standing still.
Fresh data from realestate.co.nz reveals a mixed but intriguing picture:
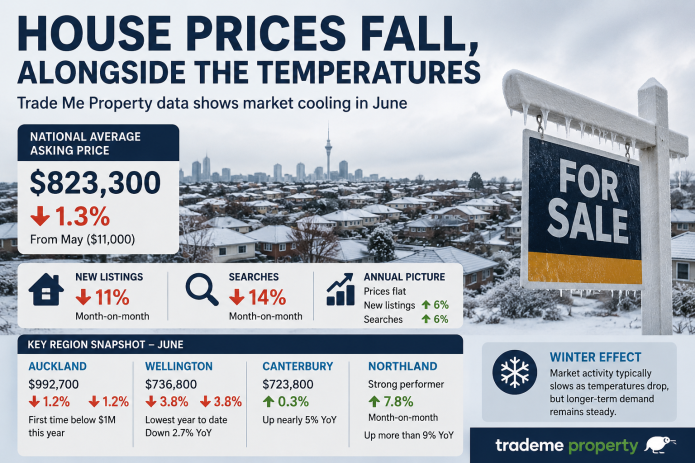
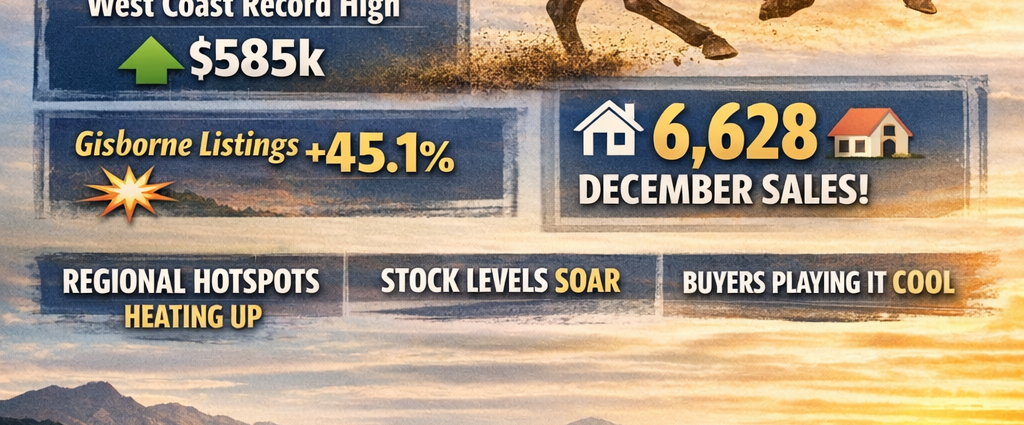
📉 National average asking price down 1.5% year-on-year to $856,730
📈 West Coast hits an all-time high of $585,881
🚀 Gisborne listings explode 45.1% year-on-year
🏠 December 2025 closes strong with 6,628 sales
It’s not a boom. It’s not a bust. It’s a market quietly repositioning.
💰 National Prices Dip — But Regional Highs Tell a Different Story
The national average asking price softened slightly, dropping 1.5% compared to January 2025. But beneath that headline figure, regional markets are telling very different stories.
🌊 West Coast Steals the Spotlight
Record average asking price: $585,881
Up 17.4% year-on-year
🌅 Other January Highs:
Gisborne: $705,145 (+8.2%)
Canterbury: $719,184 (+0.2%)
Central Otago/Lakes District: $1,621,022 (+12.0%)
Meanwhile, Marlborough experienced the sharpest fall:
Down 12.6% to $676,223
First time below $700k since October 2021
What It Means
While the national average has eased, lifestyle-driven regions are showing resilience and renewed confidence. Buyers are clearly still prepared to pay for location, long-term value, and lifestyle appeal.
Website traffic backs this up — visits to realestate.co.nz are up 12.4% year-on-year, signalling strong buyer engagement even if decisions are taking longer.

📋 Listings: Slow National Growth… But Regional Surges
January saw 9,019 new listings, up a modest 1.3% year-on-year.
But zoom in, and the story sharpens.
🔥 Regions With Double-Digit Growth:
Gisborne: +45.1% (74 new listings)
Hawke’s Bay: +21.8% (319 listings)
West Coast: +14.3% (80 listings)
Northland: +10.0% (296 listings)
These regions have hit 2026 running, suggesting vendors see opportunity.
📉 Regions That Pulled Back:
Marlborough: −27.4%
Central Otago/Lakes District: −21.4%
Coromandel: −18.3%
Wairarapa: −16.7%
Otago: −14.2%
Southland: −12.0%
Central North Island: −10.2%
Holiday hotspots and parts of the South Island appear more cautious, with some sellers potentially waiting for clearer economic signals.

🏠 Stock Levels Hit Decade High — Buyers Hold the Power
Total stock rose 2.3% year-on-year to 33,149 properties.
This marks the first January above 33,000 listings since 2014 — a major shift in supply dynamics.
Notable Stock Changes:
Gisborne: +15.1% (only region with double-digit stock growth)
Auckland, Hawke’s Bay, Wellington and Northland all recorded modest increases.
Southland: −19.1% (seventh consecutive monthly decline)
Central Otago/Lakes District: −15.1%
Otago: −10.3%
The Big Takeaway
There’s more choice for buyers than we’ve seen in years.
And buyers know it.
Banks are busy with pre-approvals, but purchasers are moving carefully — possibly waiting on further OCR cuts or political signals. The risk? Sitting on the sidelines too long could mean missing strong stock at realistic prices.
📊 December Sales Prove the Market Still Has Muscle
Despite the cautious tone, December delivered:
6,628 properties sold
Up from 5,511 in December 2024
Up from 5,142 in December 2023
Up from 4,309 in December 2022
That’s one of the strongest Decembers in recent memory.
Properties are selling. Just not frantically.

🎯 2026 Outlook: Steady Jump… Not a Sprint
The New Zealand property market is not rebounding dramatically — but it’s far from stalled.
We’re seeing:
✔ Regional momentum
✔ Vendor confidence in key lifestyle markets
✔ Increased buyer research activity
✔ Strong recent sales volumes
✔ Higher stock levels creating opportunity
It’s a patchy but promising start.
Some regions are accelerating. Others are waiting for clearer signals.
National averages show stability — but local market dynamics are now driving the real story.
And in 2026, that’s where the smart money will be watching.