


PHOTO: 🏠 A Major Shake-Up in New Zealand’s Property Rankings. PROPERTY NOISE
For the first time in more than a decade, Auckland has lost its title as New Zealand’s most expensive property market.
New data shows the Bay of Plenty has surged to the top of the national leaderboard, overtaking Tāmaki Makaurau – Auckland as average asking prices across the country cooled toward the end of the year.
According to Trade Me Property, the shift marks a watershed moment for the housing market — and reflects deeper changes in buyer behaviour, wealth distribution, and regional demand.
📊 Bay of Plenty Takes the Top Spot
Trade Me Property Customer Director Gavin Lloyd says December delivered a historic result.
“For the first time in recent history, we’ve seen the Bay of Plenty take the top spot as the most expensive region in the motu,” he said.
“The region’s average asking price climbed to $963,000, while Auckland dipped below the million-dollar mark for the first time since August.”
That shift alone signals how dramatically the regional hierarchy has changed.
⏳ A Decade in the Making
While the result may look sudden, Lloyd says the groundwork was laid over 10 years.
10 years ago:
Auckland prices sat more than $300,000 above the next most expensive regionBy 2025:
The gap had narrowed to just $100,000–$150,000
“The Bay of Plenty has consistently ranked second-most expensive for several years,” Lloyd said.
“This isn’t a shock — it’s the natural conclusion of a long-term trend.”
SUPPLIED
💎 Luxury Buyers Driving the Flip
A major factor behind the Bay of Plenty’s rise is who is buying, not just how much they’re paying.
🔑 Auckland Trends
Growing share of homes priced under $800,000
Fewer listings above $2 million
Market tilting back toward first-home buyers
🌴 Bay of Plenty Trends
Rising share of $2m+ properties
Strong demand for premium lifestyle homes
Buyer base shifting toward wealthier, discretionary purchasers
“In December, the Bay of Plenty actually recorded a higher proportion of $2 million-plus listings than Auckland,” Lloyd noted.
“That’s a clear signal the buyer demographic has changed.”
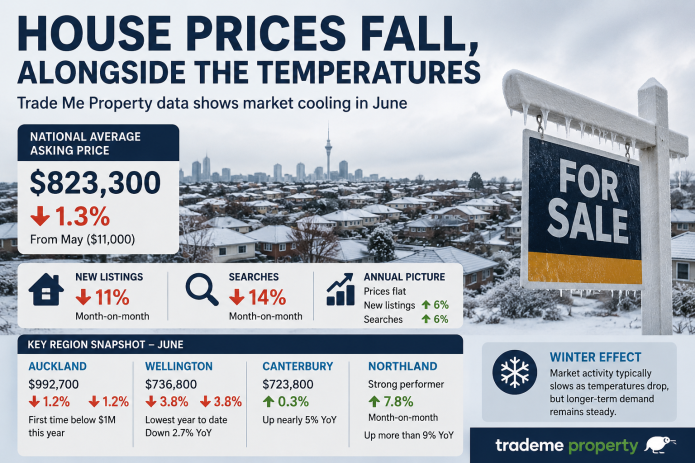
📉 National Prices Cool to One-Year Low
Nationally, the housing market softened through December.
Average asking price: $800,700
Month-on-month: −6%
Lowest level since: December 2024
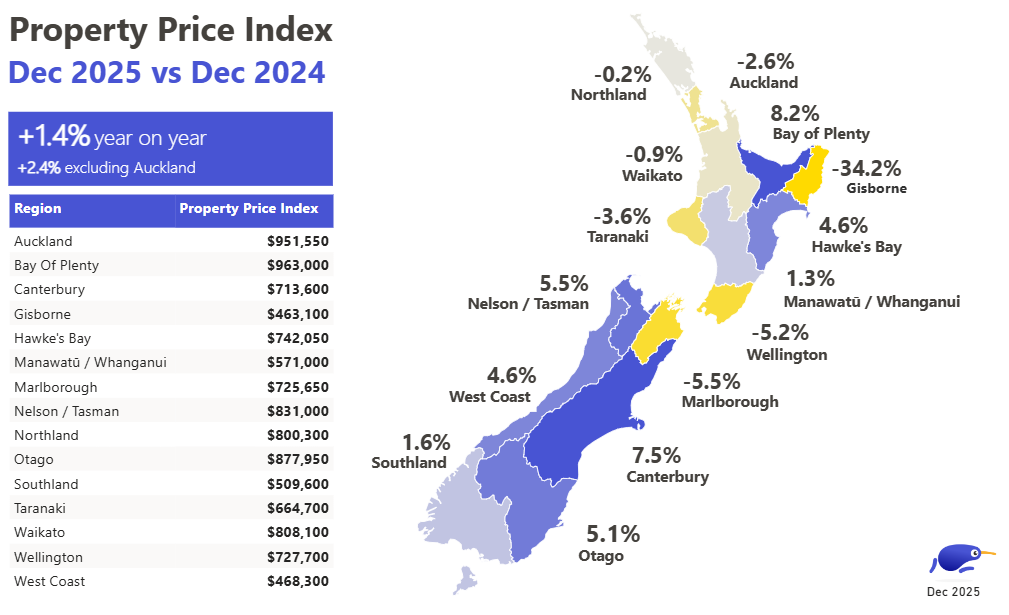
Year-on-year: +1.4%
Lloyd says the seasonal slowdown is typical.
“December often reflects the summer holiday effect, when Kiwis pause house hunting,” he said.
“What’s encouraging is that prices are still ahead of where we were a year ago — suggesting a stable base as we head into the new year.”
📍 Regional Winners & Losers Emerge
The past year highlighted a growing divide between high-growth regions and those undergoing correction.
📈 Strong Performers
Canterbury: +7.5% → $713,600
Nelson/Tasman: +5.5% → $831,000
Bay of Plenty: strongest national momentum
📉 Market Corrections
Gisborne: −34.2% → $463,100
Marlborough: −5.5% → $725,650
Wellington: −5.2% → $727,700
👀 Gisborne Drop Masks Surging Demand
Despite posting the sharpest annual decline, Lloyd warns against misreading Gisborne’s figures.
“Search activity in Gisborne jumped 44% year-on-year in December,” he said.
“That growth massively outpaced supply, which only increased by 3%.”
Because Gisborne is a small, thinly traded market, price movements can appear more dramatic than in larger cities.
“The level of buyer interest suggests this dip may be temporary, rather than a reflection of weak demand.”
🔮 What This Means for 2026
This reshuffle underscores a new reality in New Zealand property:
Regional prestige markets are no longer secondary
Lifestyle and luxury buyers are driving price leadership
Auckland’s dominance is no longer guaranteed
The market is becoming more fragmented and nuanced
The Bay of Plenty’s rise isn’t just symbolic — it reflects where wealth, lifestyle demand, and discretionary spending are now flowing.